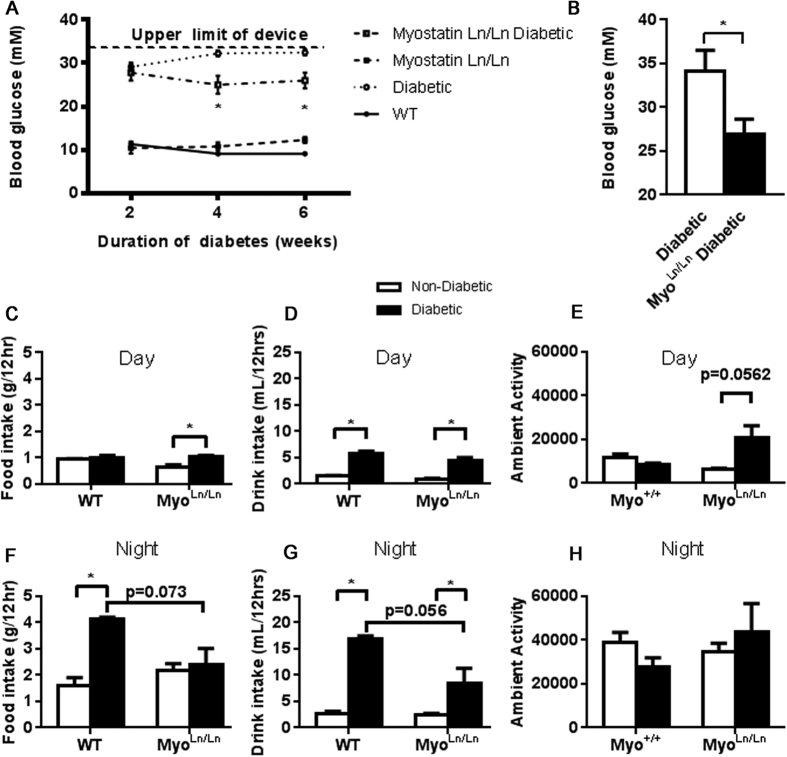
Figure 4. MyoLn/Ln diabetic mice have significantly reduced blood glucose levels and decreased food and drink consumption.
(A) Blood glucose measures over a 4 week period. Note the device used for these measurements had an upper limit of 34 mM. Black circle – WT; white circle – diabetic; black square – MyoLn/Ln; white square – MyoLn/Ln diabetic. N = 4–16. Two-way ANOVA test with Bonferroni post-hoc. *Indicates p < 0.05. (B) YSI measure of blood glucose at 8 weeks of diabetes. No upper limit. N = 3–4. (C) Daytime food intake. Non-diabetic – white bar, diabetic- black bar. N = 4. Two-way ANOVA test with Bonferroni post-hoc for all remaining graphs. *Indicates p < 0.05. D. Day-time drink intake, N = 4. (E) Day-time activity, N = 4. (F) Night-time food intake, N = 4. (G) Night-time drink intake, N = 4. (H) Night-time activity, N = 4.

