
Figure 1. ROC representing Area under the curve between different hybrids features.
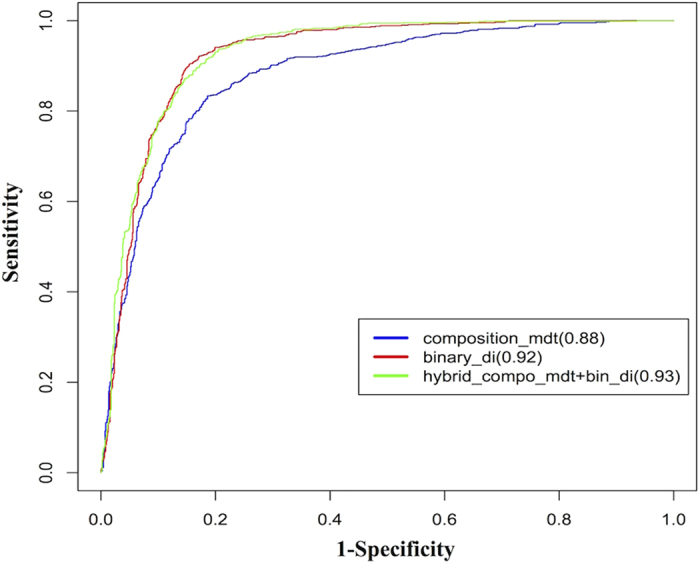
In composition profile hybrid of mono-di-trinucleotide have AUC of 0.88 (blue), binary profile of dinucleotide have AUC of 0.92 (red) and hybrid of mono-di-trinucleotide composition and dinucleotide binary display AUC of 0.93 (green).