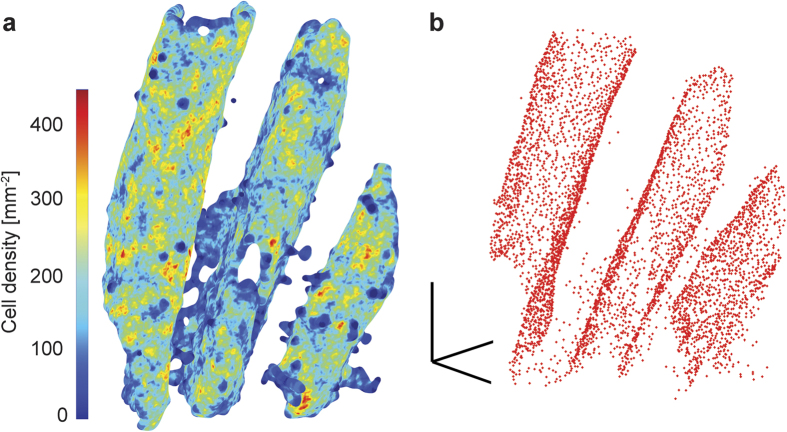
Figure 4. Purkinje layers coloured according to the local density of Purkinje cells and their location in a volume of 43 mm3.
(a) The average detected density was 165 cells per mm2, related to the manifold and volumetric cell density to 116 mm−3 of (b) localised Purkinje cells. Segmented objects were filtered in sparse distributions not connected to the Purkinje layer, which is derived and described implicitly using a level set approach. It features disconnectivities at the border of the dataset. The axes of the scale bar correspond to 1 mm (see also Supplementary Video 4).

