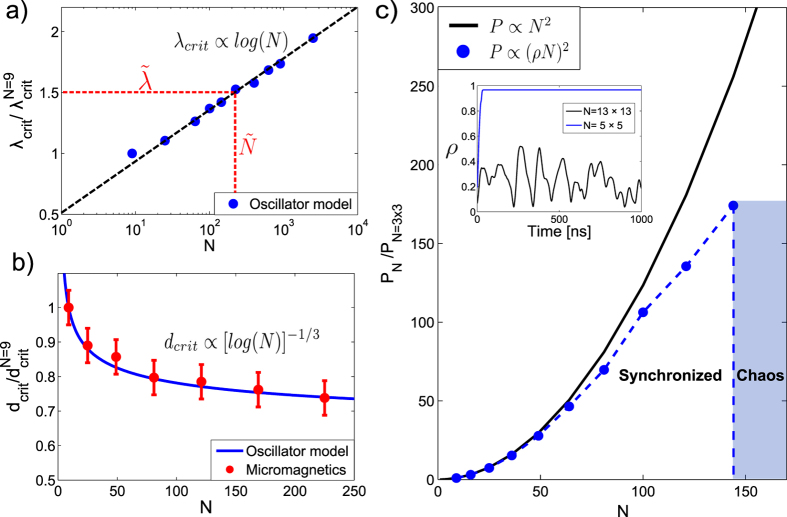
Figure 3.
(a) Critical coupling strength λcrit vs. number of oscillators N in the Kuramoto model, normalized to the case where N = 3 × 3. Red dotted line: For a system size  , there is a corresponding minimum coupling strength
  to obtain a synchronized state, and vice versa. (b) Blue solid line: Expected scaling between critical oscillator spacing, dcrit, and number of oscillators when assuming a dipolar interaction decaying as 1/d3. Red datapoints: Results from micromagnetic simulations. (c) Black solid line: Power output assuming an ideal scaling, P ∝ N2. Blue dotted line: Calculated power output for an interaction strength
  MHz, normalized to the case where N = 3 × 3. Inset: Order parameter ρ for 3 × 3 and 13 × 13 STO respectively, showing the transition from a synchronized state to chaotic behavior as the number of STO is increased.

