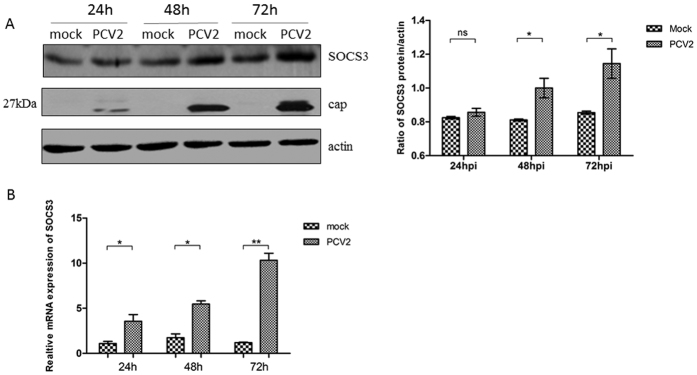
Figure 3. SOCS3 expression is elevated in PCV2-infected PK-15 cells.
PK-15 cells were infected with the PCV2-SH strain at a MOI of 0.1 for 24, 48, and 72 h. At each time point, PK-15 cells were lysed and RNA was extracted. (A) Protein expression and (B) mRNA levels of endogenous SOCS3 were analyzed. The mRNA and protein expression levels of PCV2-infected cells are presented relative to the mRNA and protein expression levels of uninfected cells. The band intensity was normalized to that of β-actin. Each experiment was performed three times, and the results are representative of one independent experiment. Statistical data were analyzed by one-way analysis of variance (*P < 0.05; **P < 0.01; and ***P < 0.001; ns, not significant (P > 0.05)). All data are expressed as the mean ± SD. The samples were derived from the same experiment, and the blots of actin and SOCS3 were processed in parallel in the same gel. The blots of the PCV2 capsid protein were performed in another gel because the bands corresponding to SOCS3 and the capsid protein were too close to differentiate. The samples for blotting were prepared at the same concentrations, and the two gels were run under the same conditions.

