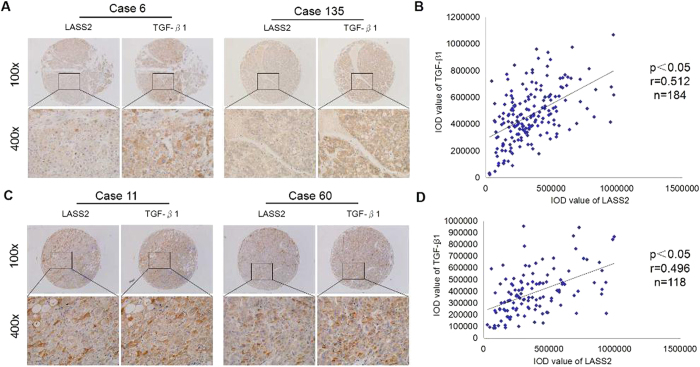
Figure 1. The relationship between LASS2 and TGF-β1 in HCC patients.
(A). Two representative cases of LASS2 and TGF-β1 expression in the test cohort. (B). Relevance of LASS2 and TGF-β1 in the test cohort. (Pearson’s correlation, r = 0.512, n = 184, p < 0.05). (C). Two representative cases of LASS2 and TGF-β1 expression in the validation cohort. (D). Relevance of LASS2 and TGF-β1 in the validation cohort. (Pearson’s correlation, r = 0.496, n = 118, p < 0.05).

