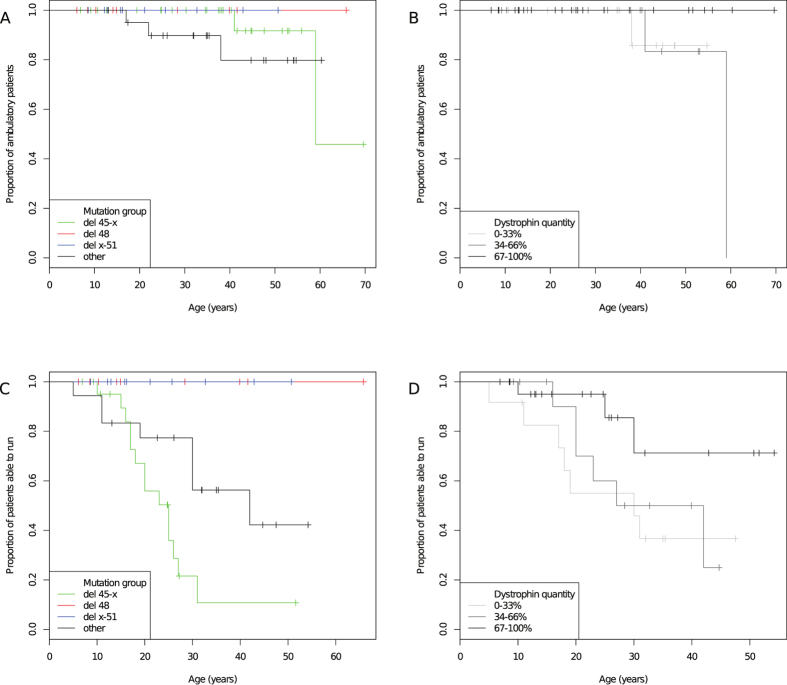
Figure 1. Kaplan-Meier plots of loss of ability to walk and run.
Age at LoA is represented, grouped by (A) mutation group (“del 45-x”, “del 48”, “del x-51”, and “other”), and (B) dystrophin quantity (0–33%, 34–66%, 67–100%). The proportion of patients able to run at increasing ages are represented by (C) mutation group, and (D) dystrophin quantity. Censored patients (able to walk or run at last follow-up) are indicated by crosses.

