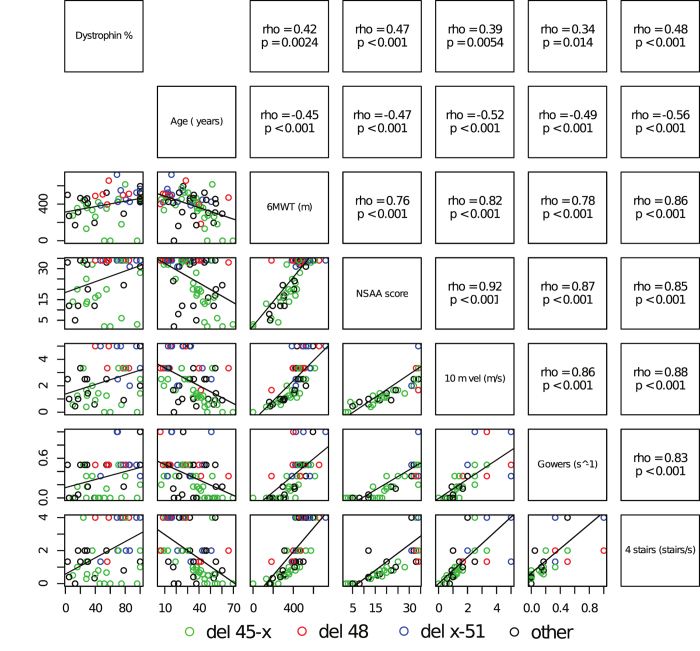
Figure 2. Correlation matrix of dystrophin quantity, age, and functional measures.
Panels in the diagonal indicate measures represented on corresponding columns and rows. Upper panels show correlation parameters (Spearman’s ρ and corresponding p-value) between measures on corresponding the row and column, while lower panels show scatter plots, with data points color-coded for mutation group, and corresponding regression lines. Correlations between dystrophin quantity and age is not shown, because age represented here is age at study procedures, and not age at biopsy (which may be years or decades earlier).

