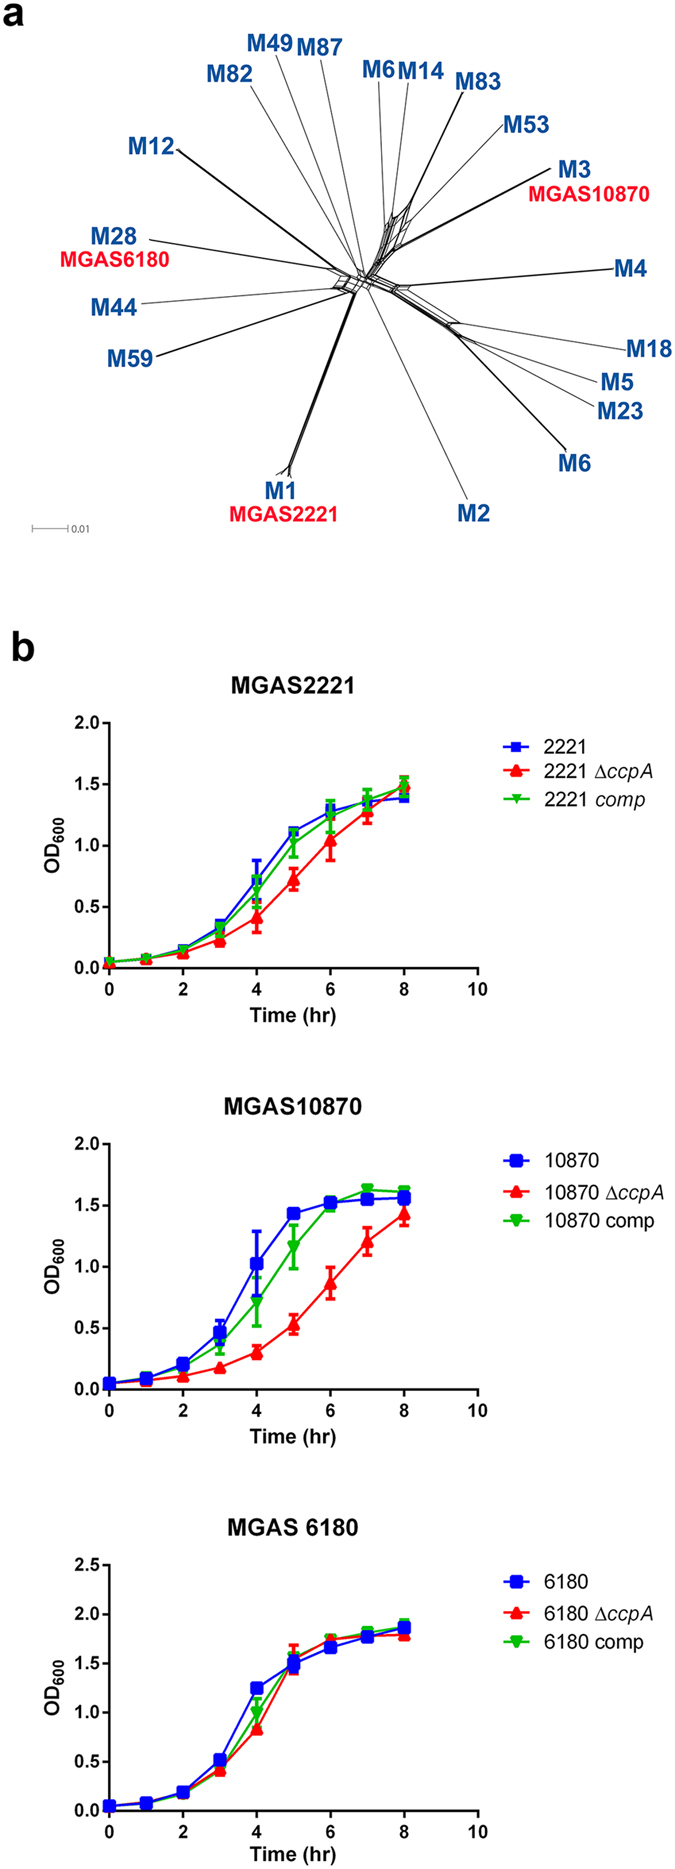
Figure 1. Characterization of the GAS M serotype strains and their ccpA derivatives.

(a) Whole genome phylogeny of sequenced GAS strains. Complete GAS genomes of indicated M serotypes (blue) were obtained from NCBI. Relationships were inferred from 68,084 core single nucleotide polymorphism (SNP) loci using SplitsTree. Location of parental strains used in this work are shown in red. (b) Growth curves for wild type, ccpA-inactivated and complemented strains in THY. Data points are mean and standard deviations from duplicate samples of each strain measured on two independent occasions.
