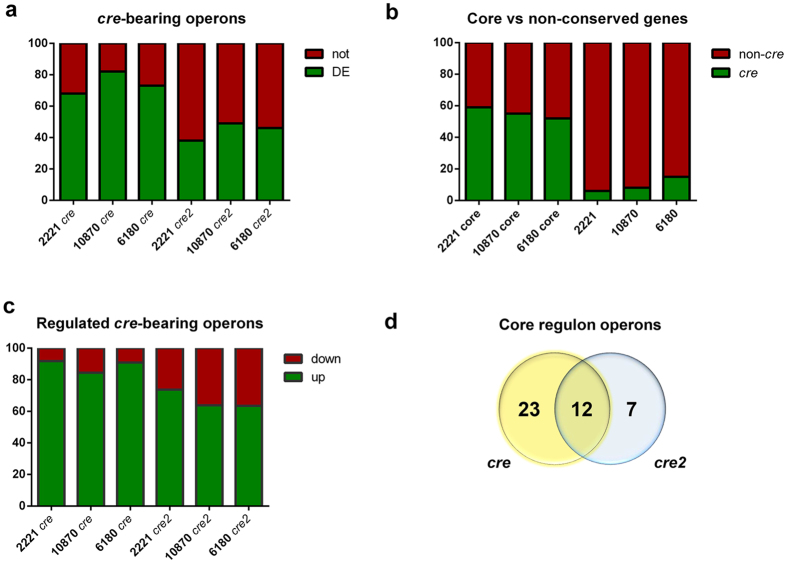
Figure 4. Distribution of cre and cre2 motifs.
(a) Percentage of cre and cre2-bearing operons that exhibit CcpA-dependent differential expression (DE) or do not (not), in the three GAS serotype strains. (b) Distribution of the core regulon genes based on the presence (cre) or absence (non-cre) of a cre site in the promoter. (c) Differentially regulated genes containing cre or cre2 operators displayed by relative percentages that are repressed (up) or activated (down) in ΔccpA. (d) Number of cre and cre2 sites in the GAS core CcpA regulon depicted as a Venn diagram.

