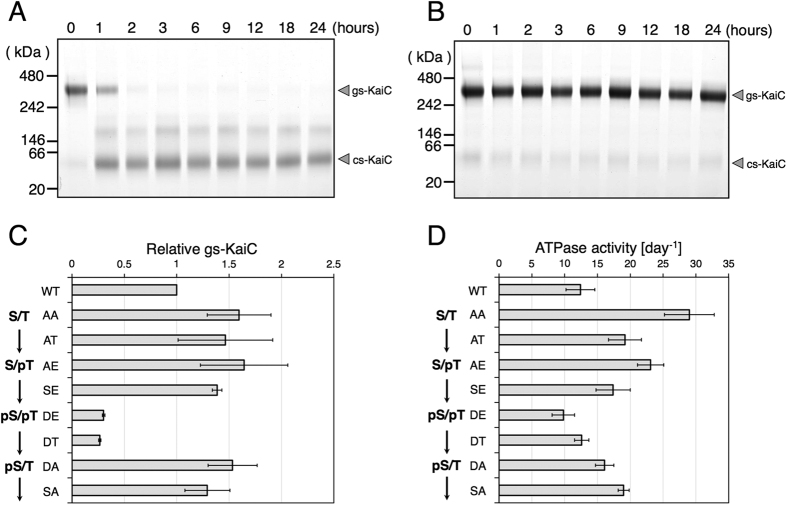
Figure 3. Conversion of KaiC conformational states.
KaiC-DE (S431D, T432E) (A) and KaiC-AA (S431A, T432A) (B) were incubated in the presence of ATP, and the reaction mixtures were subjected to BN-PAGE. (C) The eight phosphorylation state-mimicking KaiC variants were incubated in the presence of ATP at 30 °C for 24 h, and were then subjected to BN-PAGE analyses (Fig. S5). Quantities of gs-KaiC in the series of phosphorylation state-mimicking variants were plotted as relative band densities in BN-PAGE analyses of wild-type (WT) KaiC, and are listed in order of the sequences of their phosphorylation mimicking forms in the phosphorylation cycle of KaiC, as indicated in the leftmost labels. The data represent the means ± SD from three independent experiments. (D) ATPase activities (molesADP/KaiC/day) of a series of phosphorylation state-mimicking KaiC variants were measured using HPLC. The data represent the means ± SD from three independent experiments.

