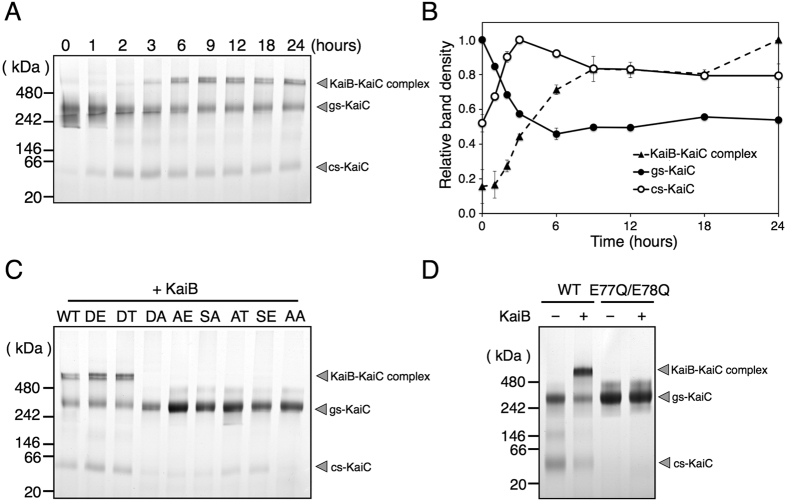
Figure 6. Specific binding of KaiB to cs-KaiC.
(A) KaiC was incubated with KaiB at 30 °C, and reaction mixtures were subjected to BN-PAGE. The upper band represents a KaiB-KaiC complex and the intermediate and lower bands correspond with gs-KaiC and cs-KaiC. (B) Densitometric quantitation of (A); The plots show gs-KaiC (●), cs-KaiC (○) and the complex (▲) at each time point. Maximum densities of the each band through the incubation (gs-KaiC at time 0 h, cs-KaiC at 3 h and the complex at 24 h) were assigned a value of 1. The data represent the means ± SD from three independent experiments. (C) Phosphorylation state-mimicking KaiC variants were incubated with KaiB at 30 °C for 12 h, and reaction mixtures were subjected to BN-PAGE analyses. (D) The ATPase variant of KaiC was incubated with or without KaiB at 30 °C for 12 h, and reaction mixtures were subjected to BN-PAGE analyses.

