-
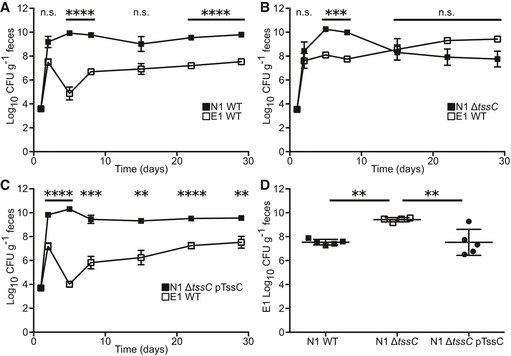
A–C
SPF C57BL/6J mice were co‐colonized with E1 and N1 wild type (WT, A, n = 5 mice), N1 T6SS mutant (ΔtssC, B, n = 4), or N1 complemented (ΔtssC pTssC, C, n = 5). Fecal CFU was quantified for E1 (open squares) and N1 (closed squares) weekly.
-
D
Four weeks post‐colonization, E1 fecal recovery was compared between the N1 WT, ΔtssC, and ΔtssC pTssC groups.
Data information: Results are representative of three independent experiments. Data are presented as mean ± SEM (A–C) or mean ± SD (D). n.s., not significant; **
P < 0.01, ***
P < 0.001, ****
P < 0.0001. Statistical significance was determined by unpaired, parametric, two‐tailed Student's
t‐test at each time point (applying Bonferroni correction), comparing the co‐colonizing strains (A–C) or one‐way ANOVA, Tukey's multiple comparisons test (D).