-
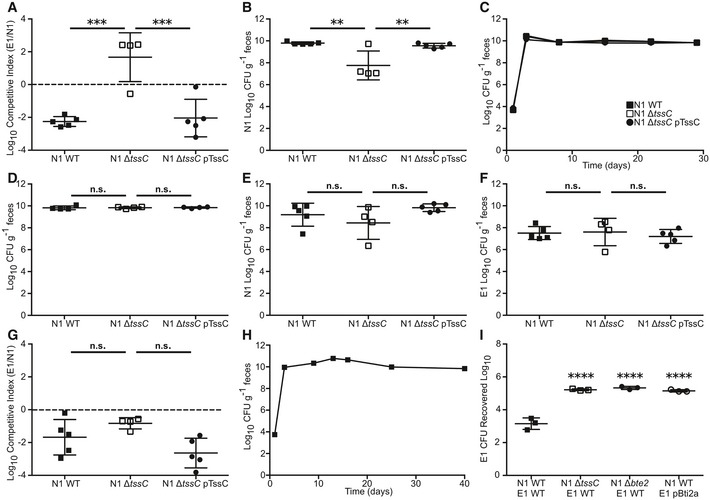
A, B
SPF mice were co‐colonization with E1 WT and N1 WT (n = 5), T6SS mutant (ΔtssC, n = 4), or complemented (ΔtssC pTssC, n = 5). Fecal CFU was monitored for 4 weeks post‐colonization. N1 clone fecal CFU was compared between groups at the 4‐week time point (A) and the competitive index of E1 over N1 was determined for each mouse (B).
-
C, D
Mice (n = 4) were mono‐colonized with N1 WT, T6SS mutant (ΔtssC), or complemented (ΔtssC pTssC), and fecal CFU was determined for 4 weeks (C). Comparison of fecal CFU was made between groups after 4 weeks (D).
-
E–G
SPF mice were co‐colonized with E1 and N1 WT (n = 5), T6SS mutant (ΔtssC, n = 4), or complemented (ΔtssC pTssC, n = 5). Fecal CFU at 1 day post co‐colonization was determined for N1 (E) and E1 (F) and competitive index of E1 over N1 was calculated for each mouse (G).
-
H
SPF mice (n = 4) were mono‐colonized with E1 and fecal CFU determined over time.
-
I
In vitro competitions were performed between E1 WT and N1 WT, N1 ΔtssC, or N1 Δbte2, or between E1 Bti2a and N1 WT (n = 3 competitions). Recovered CFU of E1 was quantified after each competition, and statistical difference from E1 WT recovered after competition with N1 WT was determined.
Data information: Results are representative of three independent experiments. Data are presented as mean ± SD (A, B, D–G, I) or mean ± SEM (C and H). A dashed line denotes equal recovery of competitors. n.s., not significant; **
P < 0.01, ***
P < 0.001, ****
P < 0.0001. Statistical significance was determined by one‐way ANOVA, Tukey's multiple comparisons test (A, B, D–G, I).