-
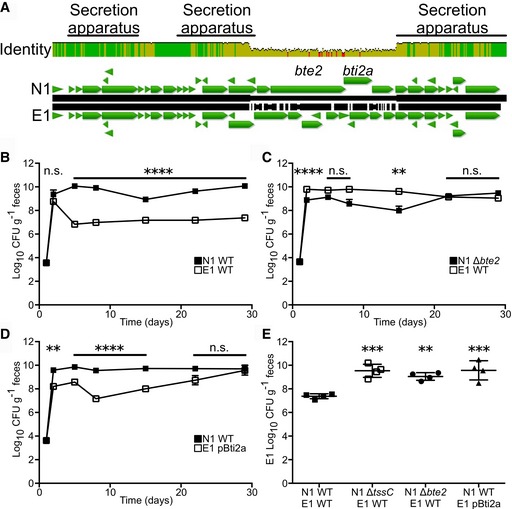
A
Nucleotide alignment of the T6SS locus from N1 and E1. Percent identity is indicated as height, green representing high homology with red highlighting non‐conserved regions.
-
B–E
Co‐colonization of N1 WT (B and D, n = 4 mice) or N1 Δbte2 (C, n = 4) with E1 WT (B and C) or E1 overexpressing Bti2a (E1 pBti2a, D). Fecal CFU was monitored over time (B–D) and E1 CFU compared to N1 WT‐E1 WT group at 4 weeks post co‐colonization (E).
Data information: Results are representative of two independent experiments. Data are presented as mean ± SEM (B–D) or mean ± SD (E). **
P < 0.01, ***
P < 0.001, ****
P < 0.0001. Statistical significance was determined by unpaired, parametric, two‐tailed Student's
t‐test at each time point (applying Bonferroni correction) comparing the co‐colonizing strains (B–D) or one‐way ANOVA, Tukey's multiple comparisons test (E).