
Figure 4. Microbial transplantation induces PPARγ pathway activation in HF‐R mice liver.
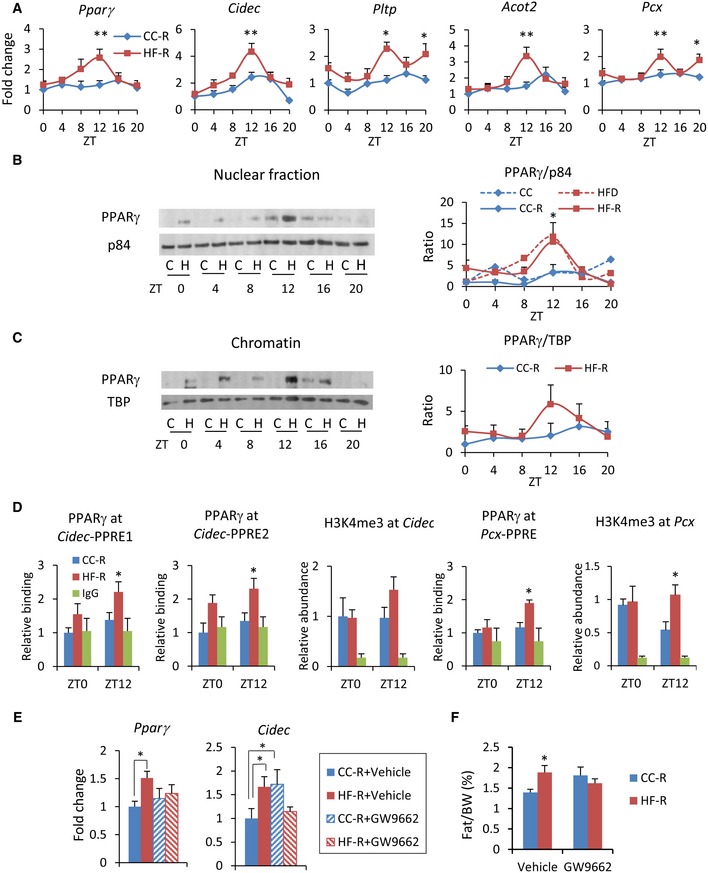
- PPARγ target genes expression measured by qPCR (n = 5–12 each group, two‐way ANOVA, post hoc Holm–Sidak comparisons, *P < 0.05, **P < 0.01). Error bars represent SEM.
- Immunoblot analysis of PPARγ in nuclear fraction. On the right, quantification of PPARγ normalized to p84 is shown. Average of donor mice (ref. 19) and four experimental replicates per time point, per group of recipient mice (two‐way ANOVA, post hoc Holm–Sidak comparisons, *P < 0.05). Error bars represent SEM.
- Immunoblot analysis of PPARγ in chromatin fraction. On the right, quantification of PPARγ normalized to the TBP is shown. Average of 4 experimental replicates, per time point, per group (two‐way ANOVA, no significant difference). Error bars represent SEM.
- Chromatin recruitment of PPARγ at PPAR binding site contained in Cidec and Pcx promoters (n = 3–5 per group, per ZT, two‐way ANOVA, post hoc Holm–Sidak comparisons, *P < 0.05). H3K4me3 abundance at Cidec and Pcx promoters (n = 4–7, per group, per ZT, unpaired, two‐tailed Student's t‐test, *P < 0.05). Error bars represent SEM.
- Pparg and Cidec gene expression at ZT12 in the liver of fecal‐transplanted animals treated with GW9662 or vehicle (n = 6–9 per group, two‐way ANOVA, post hoc Holm–Sidak comparisons, *P < 0.05). Error bars represent SEM.
- % epididymal fat mass/body weight of fecal‐transplanted animals treated with GW9662 or vehicle (n = 6–9 per group, unpaired, two‐tailed Student's t‐test, *P < 0.05). Error bars represent SEM.