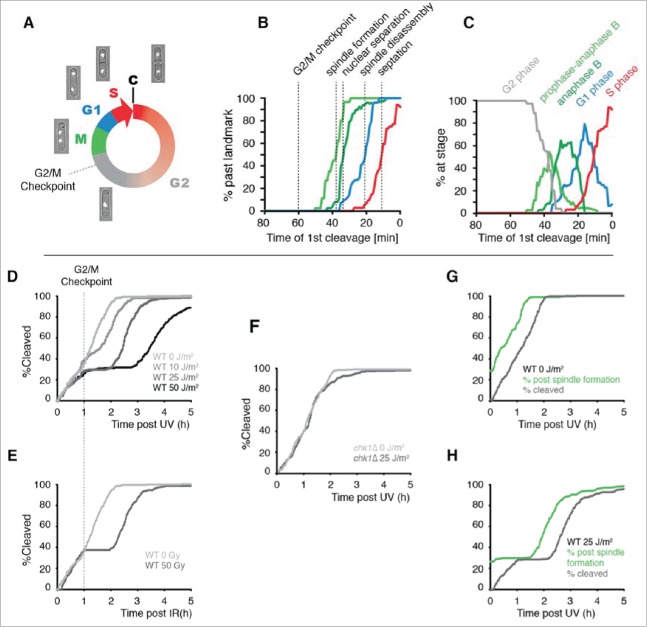
Figure 2.
The use of cleavage time to determine cell cycle stage in asynchronous populations. (A) Illustration of the fission yeast cell cycle with sample images from a time-lapse movie of a cell expressing tagged histone H3. C = cleavage/cytokinesis. (B) Determination of the timing of cell cycle landmarks. Confocal microscopy was used to make time-lapse movies of strains expressing GFP fused to α-tubulin (Atb2-GFP) or RPA1 (Rad11-mYFP). Cell cycle landmarks were manually scored as described in Fig. S8. A moving average of the percentage of cells that had passed the indicated landmark was calculated using a 15 min window at increments of 1 min (n = 200 to 300 cells for each experiment). The position of the G2/M checkpoint, determined in panels D and E, is also shown. (C) The percent of cells at the indicated stages were determined from the data in B by calculating the percent of cells that had passed one landmark but had yet to pass the subsequent landmark as described in detail in Fig. S8. (D-F) Cells pass the G2/M checkpoint 1 h before cleavage. Kinetics of the first cleavage event is shown for 300 cells with the indicated genotypes and irradiation conditions (UV or X-rays). (G-H) The checkpoint response to UV occurs prior to mitotic spindle formation. The kinetics of spindle formation and cleavage are shown for 300 cells expressing tagged α-tubulin (Atb2-GFP) imaged after mock irradiation or exposure to 25 J/m2.

