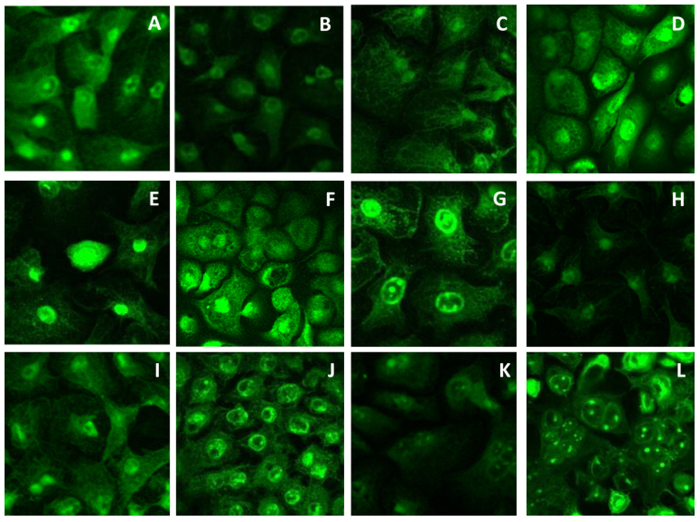
Figure 7. Confocal microscopic images showing transport pathway of FITC-labelled insulin through TR146 buccal cell layers in the presence of amino acid concentrations that effectively enhanced insulin permeability.
Insulin observed to traverse transcellularly with localisation in the nucleus. Control (A), Arg 50 μg/ml (B), Asp10 μg/ml (C), Asp 200 μg/ml (D), Glu 10 μg/ml (E), Glu 100 μg/ml (F), Glu 200 μg/ml (G), Hist 10 μg/ml (H), Lys 10 μg/ml (I), Lys 100 μg/ml (J), Lys 200 μg/ml (K), Na 200 μg/ml (L).

