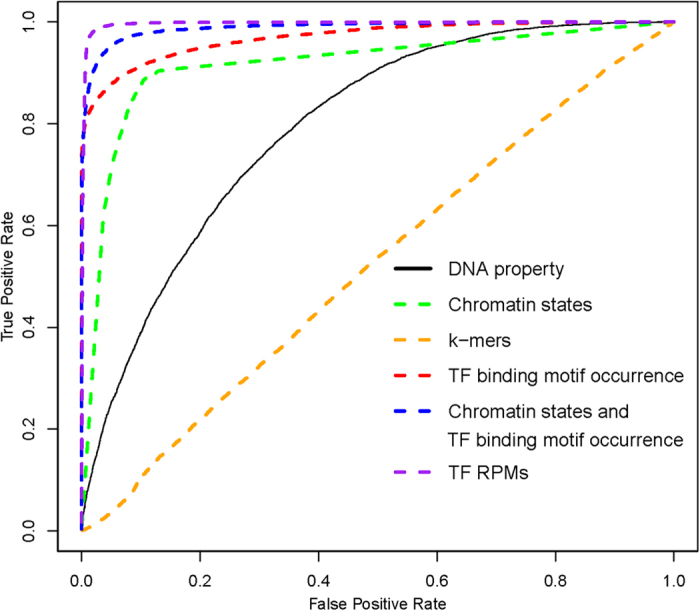
Figure 2. The receiver operator characteristic (ROC) curves for selected feature groups.

Area under the ROC curve (AUC): DNA property features (black line): 0.793; TF binding motif occurrence features (red dashed line): 0.9698; k-mer features (orange dashed line): 0.5213; chromatin state features (green dashed line): 0.9159; chromatin state and TF binding motif occurrence features (blue dashed line): 0.989; TF RPM features (purple dashed line): 0.9964. TF RPM represents the Reads Per Million mapped reads per base pair densities (RPM) of ChIP-Seq data from 61 TFs.
