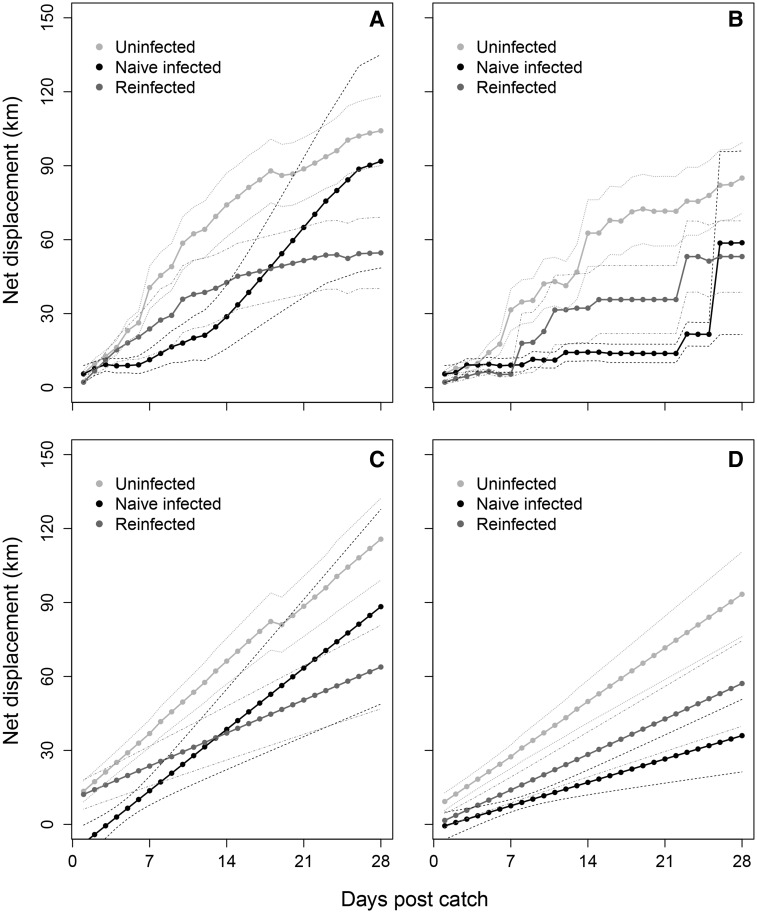
Fig. 3.
Average of net displacement (km; ± SE) of Bewick’s swans for the first 4 weeks after capture, from raw values (A and B), and predicted values from the most parsimonious model (C and D; Supplementary Tables S11 and S13) including effects of infection category (uninfected: light gray; re-infected: dark gray; naïve-infected: black). Displacement was interpolated from GPS data and observer resightings as remaining at the former site until seen elsewhere (“minimum”; B and D); or intervening days at linear average positions between resighting locations (“average”; A and C). All values represent mean (filled circles) ± SE (dashed lines).

