Figure 4.
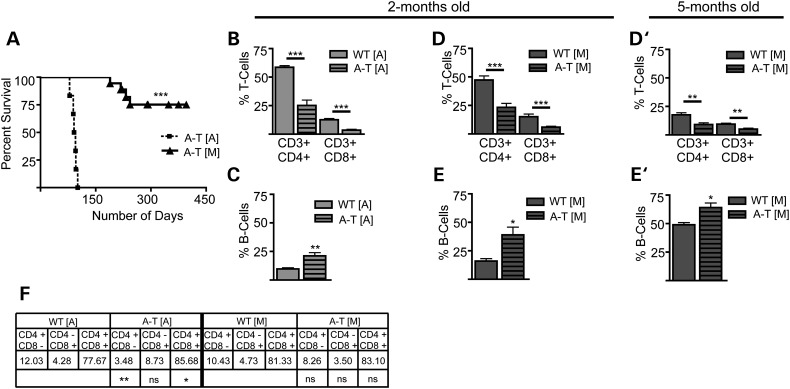
Determination of lifespan and characterization of immunophenotype in Atm mutant mice. (A) Kaplan–Meier survival curve illustrates a significant increase in the survival of A-T [M] (n = 25) mice as compared with the A-T [A] (n = 6) animals. (B) Flow cytometry Analysis of circulating T-cells in A-T [A] animals (light gray bar) shows a significant decrease in CD3+/CD4+ and Cd3+/CD8+ at 2 months of age. (C) The percentage of circulating B-cells (B220+) in A-T [A] mice is significantly increased at 2 months of age. (D and D′) A-T [M] mice show a significant decrease in the percentage of circulating T-cells (CD3+/CD4+ and Cd3+/CD8+) at 2 months and 5 months of age, respectively. (E and E′) A-T [M] mice also had and a significant increase in the percentage of circulating B-cells (B220+) at 2 months and 5 months of age, respectively. (F) Flow cytometry analysis found a significant decrease in the percentage of CD4+/CD8− cells and a significant increase in the CD4+/CD8+ double positive T-cells residing in the thymus of 3-month-old A-T [A] (light gray striped bar) mice as compared with thymocytes harvested from WT [A] mice (light gray bar). *P < 0.05, **P < 0.01, ***P < 0.001 relative to wild-type control; Student's t-test. Data plotted as mean ± S.E.M. of (n ≥ 3) samples isolated from independent animals. A-T [A] refers to (Atmtm1Awb/tm1Awb), WT [A] (Atmtm1Awb+/+), A-T [M] (Atmtm1Mmpl/tm1Mmpl), WT [M] (Atmtm1Mmpl+/+).

