Figure 7.
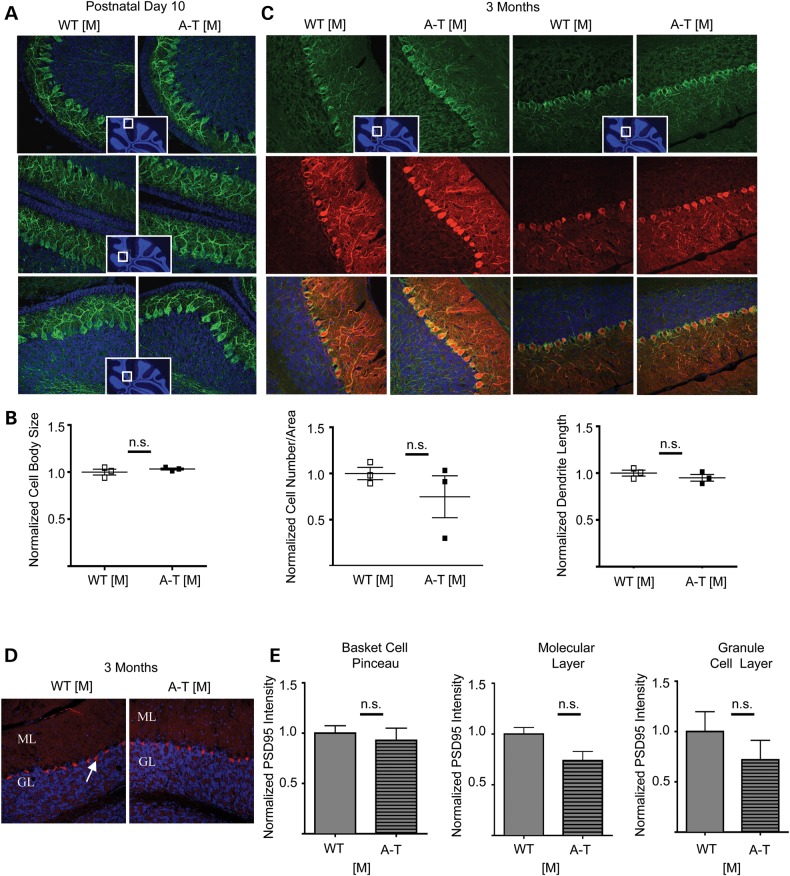
Immunohistochemical analysis of cerebellar sections. (A) Representative images of cerebellar sections from postnatal day 10 WT [M] and A-T [M] mice using the marker SMI-32 (Green). (B). Multiple parameters were measured for the Purkinje cells of the postnatal day 10, WT [M] and A-T [M] mice including cell body size, cell number per area and dendritic length. No significant (n.s) differences were observed when analyzed using the Student's t-test. Inserts show the location in the cerebellum of the prospective sections. (C) Immunohistochemical analysis of 3-month-old cerebellar sections. Representative images of cerebellar sections from WT [M] and A-T [M] mice using the markers SMI-32 (Green) and Calbindin (Red). The Purkinje cells co-labeled with these two markers and no gross abnormalities were observed in either genotype. Inserts show the location in the cerebellum of the prospective sections. Three mice were analyzed from each genotype. A-T [M] refers to (Atmtm1Mmpl/tm1Mmpl), WT [M] (Atmtm1Mmpl+/+). N = 3 mice per genotype, with at least three sections quantified per genotype. (D) Representative image of cerebella from 3-month-old WT [M] and AT [M] mice labeled with an anti-PSD95 antibody. Arrow indicates labeling in Basket cell pinceau. ML: molecular layer, GL granule layer. (E) No significant differences (n.s) were observed when the fluorescent intensity was quantified within the basket cell pinceau, the molecular layer and the granule layer. N = 3 per genotype. P > 0.05 Students T-test.

