Figure 7.

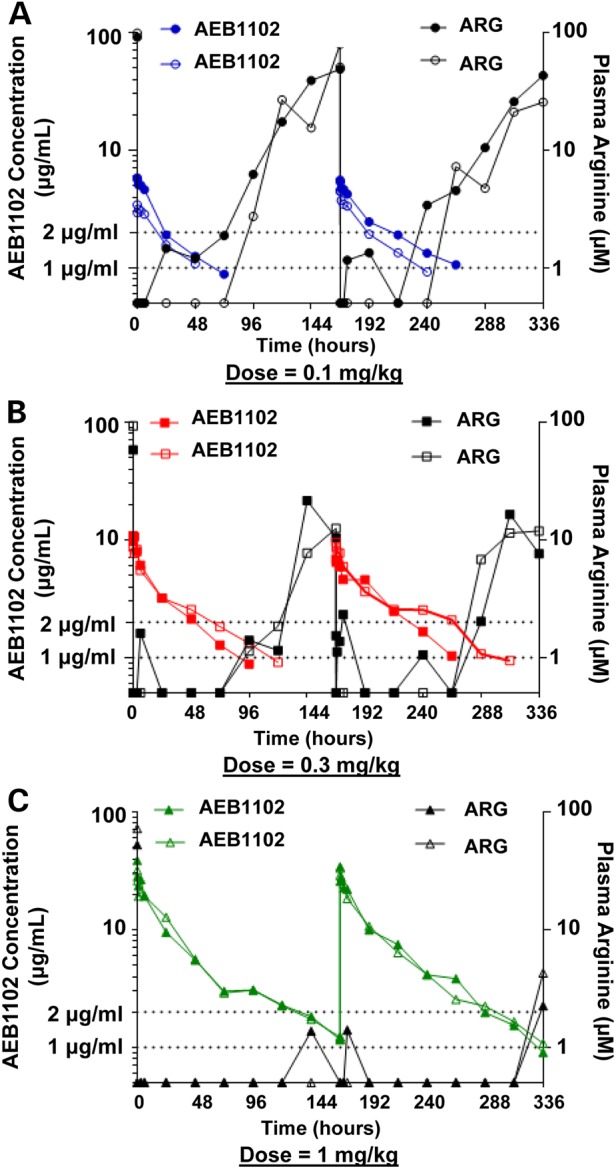
AEB1102 dose studies in cynomolgus monkeys. (A) The concentration of AEB1102 and plasma arginine levels are shown for monkeys after single and repeat intravenous dosing at 0.1 mg/kg (semi-log scale). Doses were administered at Days 1 and 8. The solid-filled circles represent Monkey #1 and unfilled circles represent Monkey #2. (B) The concentration of AEB1102 and plasma arginine levels are shown in monkeys after single and repeat intravenous dosing at 0.3 mg/kg (semi-log scale). Doses were administered at Days 1 and 8. The solid-filled squares represent Monkey #1 and unfilled squares represent Monkey #2. (C) The concentration of AEB1102 and plasma arginine levels in monkeys are shown after single and repeat intravenous dosing at 1 mg/kg (semi-log scale). Doses were administered at Days 1 and 8. The solid-filled triangles represent Monkey #1 and unfilled triangles represent Monkey #2.
