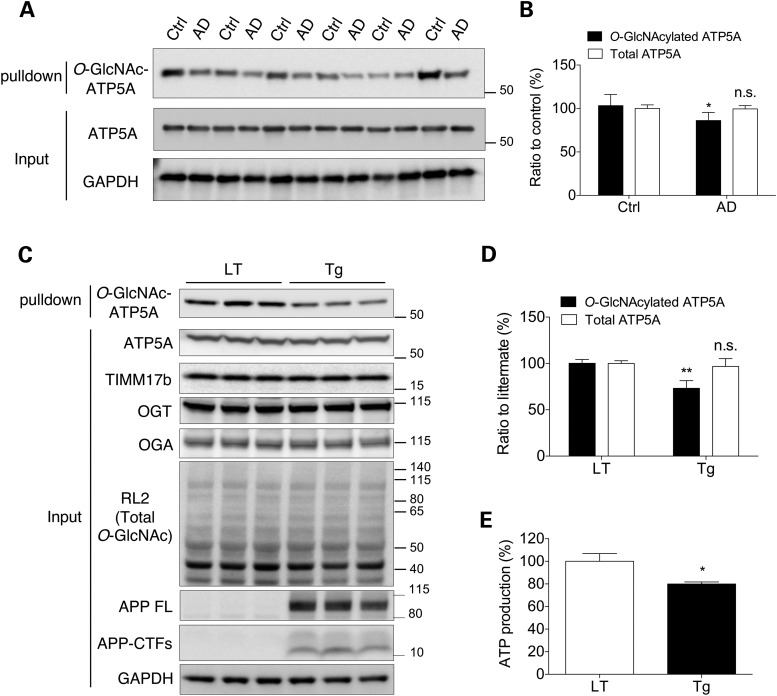
Figure 1.
Decreased O-GlcNAcylation and ATP synthase activity in AD model brains. (A) O-GlcNAcylated ATP5A in the brains from AD patients (AD) and controls (Ctrl). Total proteins were extracted from the dissected entorhinal cortex of AD and control brains to determine the expression levels of the indicated proteins. In the top panel, total O-GlcNAcylated proteins were pulled down with sWGA-agarose beads from entorhinal cortical lysates and the level of O-GlcNAc-ATP5A was then assessed by western blotting with an anti-ATP5A mAb (n = 6 per group). (B) The intensities of total ATP5A and O-GlcNAc-ATP5A in (A) were analyzed using densitometry and the level of O-GlcNAc-ATP5A was normalized to ATP5A. (C) O-GlcNAcylated ATP5A in the Tg6799 (Tg) mouse brain. Total proteins were extracted from the dissected cortices of Tg6799 mice and LTs to determine the expression levels of the indicated proteins. In the top panel, total O-GlcNAcylated proteins were pulled down with sWGA-agarose beads from cortex lysates and the level of O-GlcNAc-ATP5A was then assessed by western blotting with an anti-ATP5A mAb (n = 5 per group). (D) The intensities of total ATP5A and O-GlcNAc-ATP5A in (C) were analyzed using densitometry and the level of O-GlcNAc-ATP5A was normalized to ATP5A. (E) ATP production was measured in brain extracts from Tg6799 mice (Tg) and LTs (n = 5 per group). The results were represented as mean ± standard error from three independent experiments. **P < 0.01; *P < 0.05; n.s.: non-significant.

