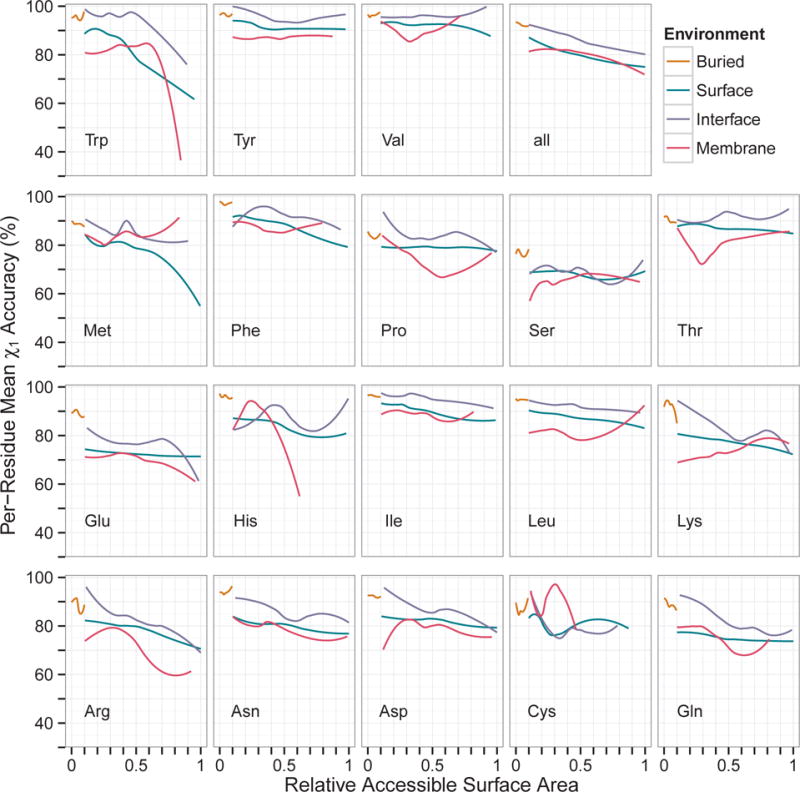
Figure 5.

Prediction accuracy as a function of relative accessible surface area (RASA). Monomeric and multimeric proteins were combined. Residues with RASA above unity were excluded. The data were smoothed using local regression (loess). Values were averaged for OSCAR-star, RASP, Rosetta, Sccomp-S, and SCWRL4. B: buried, S: surface, I: interface, M: membrane-spanning.
