
Figure 3. The average of SOC contents (measured SOC and simulated SOC using allometric root C input, fixed root C input and N3 root C input estimations for the period 1987–2010 (error bars = + s.e.m., n = 6 for measured values and n = 24 for simulated values).
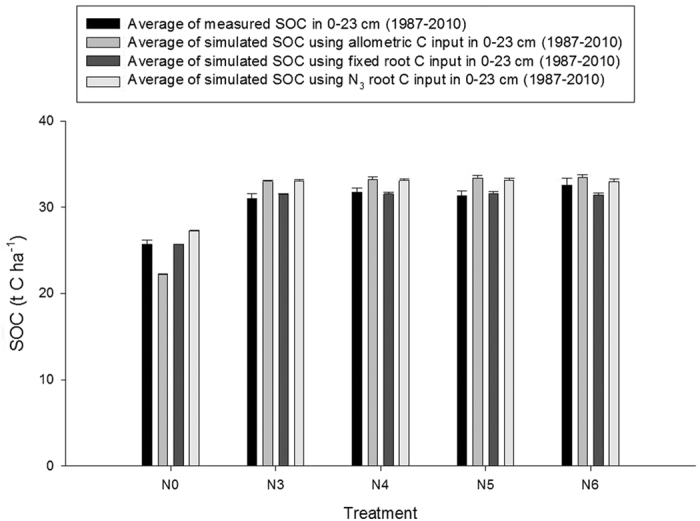
See Table 1 for details of N treatments.