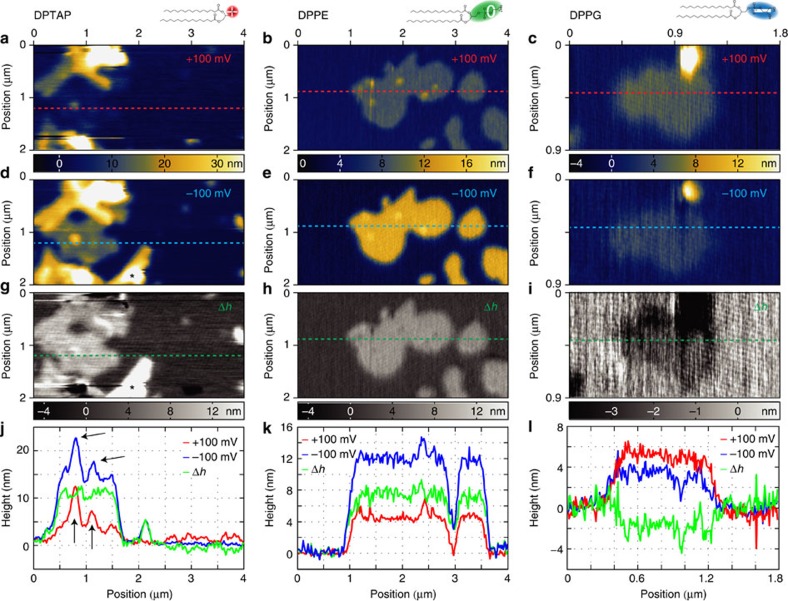
Figure 2. CIHD measurements of phospholipids.
SICM images of DPTAP, DPPE and DPPG scanned at bias potentials of first +100 mV (a–c) and then −100 mV (d–f). All scans show apparent heights of the lipids that differ from the 5 nm physical height measured by AFM. For DPTAP and DPPE the +100 mV topographies are compressed, while for DPPG it remains somewhat unchanged. At −100 mV the topographies of DPTAP and DPPE are stretched by 8.5 and 7 nm, respectively, while the DPPG topography is compressed by 2.5 nm. (g–i) The difference Δh between the two apparent topographies; multilayer structures in the lipids vanish giving uniform structures. (j–l) Line profiles from a–i. Vesicles on top of the bilayer in j, indicated by black arrows, disappear in the Δh profile underlining the topography independence of the CIHD images. During the imaging of DPTAP, a vesicle (*) settled down between scan a and d, this was excluded from further analysis. DPTAP and DPPE images are 2 × 4 μm2 with a pixel size of 20 nm, DPPG is 0.9 × 1.8 μm2 (pixel size 8 nm). The colour scales between the ±100 mV images of each lipid are valid for both.

