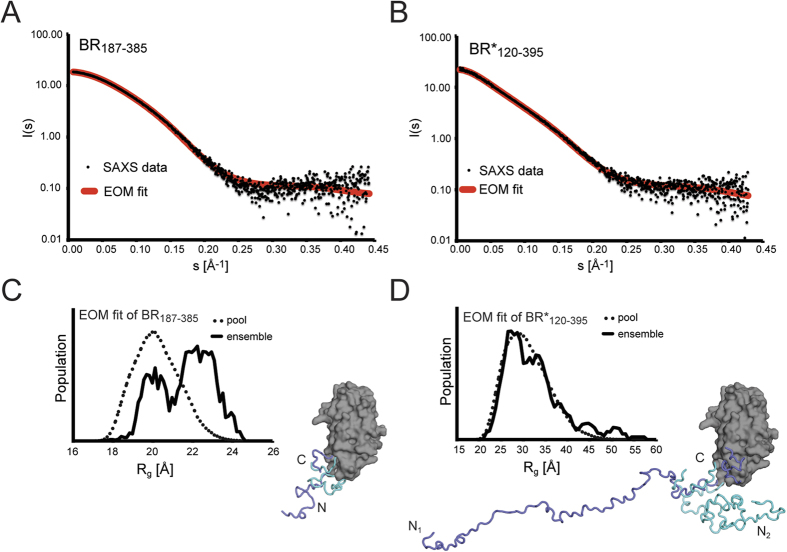
Figure 2. The N-terminal region BR120–186 forms a non-globular, flexible structure as revealed by SAXS.
(A,B) Processed solution scattering data (black dots) from (A) BR187–385 and (B) BR*120–395 fit to the theoretical scattering curves (red lines) from ensembles of 50 monomer models obtained from the ensemble optimization method (EOM) with χ-values of 0.9 and 1.7. (C,D) The histograms of the radii of gyration distribution of the pool of 10 000 structures generated by EOM (dotted lines) and the Rg distribution of the selected ensembles (solid lines). (C) The ensemble of 50 BR187–385 molecules selected by EOM was separated into two groups. The first group had an Rg value of around 20 Å and is represented by the molecular model with the extension colored in cyan. The second had an extended Rg value of 22.5 Å and is represented by the molecular model with the extension colored in blue. (D) The ensemble of 50 BR*120–395 molecules had a similar distribution of Rg values as compared the large pool of molecules with random conformations of the extensions. The two illustrated models displayed in blue and cyan have Rg values of 52 and 26 Å, respectively.

