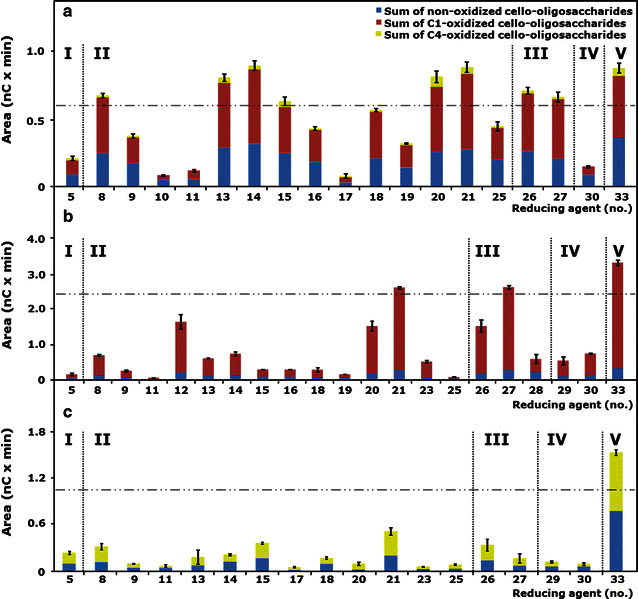
Fig. 5.

Released oligosaccharides from RAC incubated with three different MtLPMOs. RAC was incubated with a MtLPMO9A, b MtLPMO9B and c MtLPMO9C using different reducing agents. The total sum is shown of integrated peak areas of released C1- (red), C4- (yellow) oxidized and non-oxidized (blue) gluco-oligosaccharides after incubation of MtLPMO9A, MtLPMO9B and MtLPMO9C (2.5, 5 and 2.5 mg × g−1 substrate, respectively) with regenerated amorphous cellulose (RAC; 1.5 mg × mL−1) based on HPAEC. The reducing agents (1 mM) are numbered (X-axes) and specified in Table 2. Vertical dotted lines separate reducing agents of the five structural groups (Fig. 4). The threshold (horizontal dashed dotted line) is set to 70 % of the released products from RAC incubated with the MtLPMOs in the presence of ascorbic acid (no. 33) (Table 2). See “Methods” for data analysis. All incubations were performed in duplicates, and the standard deviation is represented by error bars, which correspond to one cumulated SD (error bar = ± SDtot; with SDtot = √SD21 + SD22 +…)
