Fig. 6.

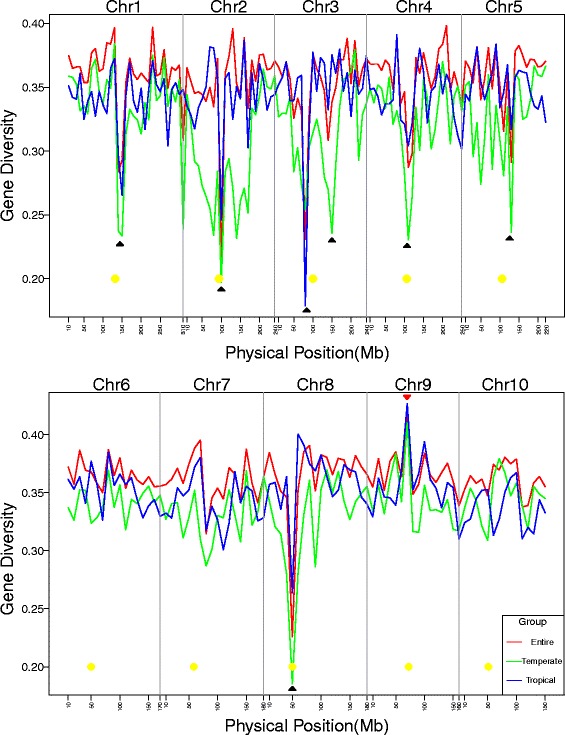
GD distribution of whole genome with 10-Mb bin size in three major groups. Yellow circles are centromere positions, black arrows indicate low-GD hotspots, and red arrows indicate high-GD hotspots

GD distribution of whole genome with 10-Mb bin size in three major groups. Yellow circles are centromere positions, black arrows indicate low-GD hotspots, and red arrows indicate high-GD hotspots