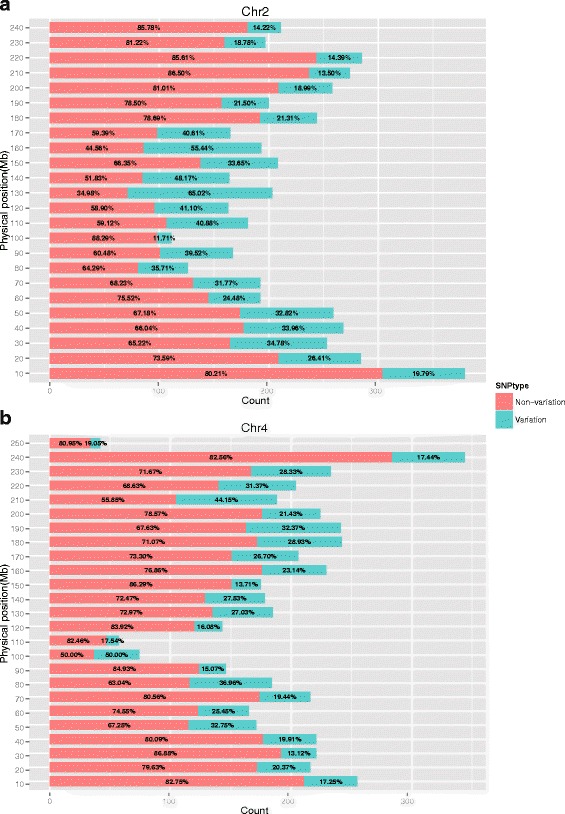
Fig. 7.

Distribution of variant SNPs and variant SNPs/total SNPs ratio of the two (Chr 2 and Chr 4) most diverse chromosomes by 10-Mb bin size. a Bar plot of variant SNPs count and variant SNPs/total SNPs ratio in Chr 2. b Bar plot of variant SNPs count and variant SNPs/total SNPs ratio in Chr 4. In each bar, percentage number on red part and cyan part represent non-variant SNPs/total SNPs ratio and variant SNPs/total SNPs ratio of the corresponding bin, respectively
