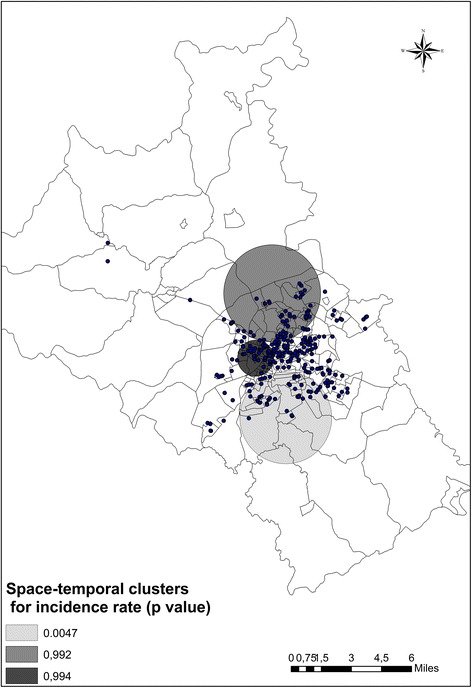
Fig. 2.

Spatial-temporal clusters of new cases of tuberculosis in the urban area of Divinópolis, MG, Brazil from 2002–2012. The p-values indicate the significance of the reduction in incidence rate according to time-window for each cluster

Spatial-temporal clusters of new cases of tuberculosis in the urban area of Divinópolis, MG, Brazil from 2002–2012. The p-values indicate the significance of the reduction in incidence rate according to time-window for each cluster