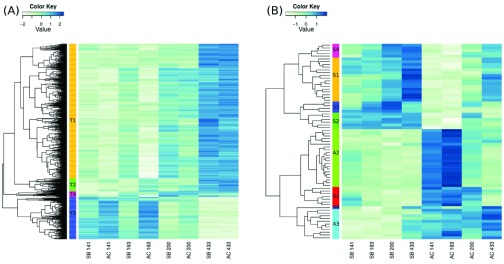
Figure 3. Heatmap of differentially expressed genes in the Arctic charr developmental transcriptome.
Two morphs (SB and AC) are represented, at four timepoints. ( A) The 1603 genes with expression difference among time points, here clustered into four groups. ( B) The 71 genes differentially expressed between morphs are clustered into 4 groups for each morph. High expression is indicated by blue and low expression by beige.

