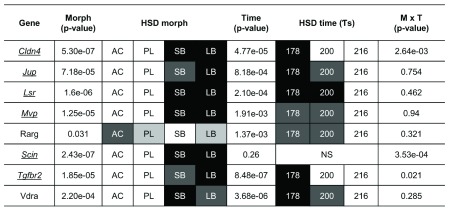
Figure 6. Expression differences of craniofacial candidate genes in developing head of Arctic charr morphs.
Relative expression ratios, calculated from the qPCR data, were subjected to an ANOVA to test the expression differences amongst four charr groups and three close time points ( τs). The underlined gene names reflect significant difference between SB and AC-charr. A post hoc Tukey’s test (HSD) was performed to determine the effects of morphs, time and morph-time interaction (M X T). White boxes represent low expression, while black boxes represent high expression. The shading represents significant different expression between the samples (α = 0.05, NS = not significant). The genes studied were, Claudin 4 (Cldn4), adseverin (Scin), Junction plakoglobin (Jup), Lipolysis stimulated lipoprotein receptor (Lsr), Major vault protein (Mvp), Transforming growth factor beta receptor II (Tgfbr2) Vitamin D receptor a (Vdra) and Retinoic acid receptor gamma-A (Rarg).

