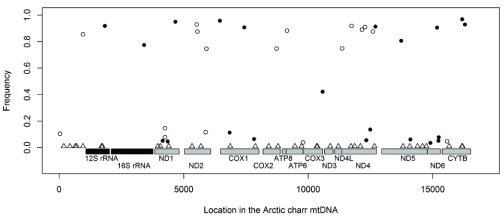
Figure 7. Genetic divergence in the mtDNA between SB- and AC-charr.
The frequency differences between morphs of candidate SNPs, estimated from the RNA-sequencing, graphed along the mtDNA chromosome. The SNPs indicate whether the derived allele is of higher frequency in SB (black dots) or AC (open circles). Sites of divergence between the Icelandic stocks and the Canadian reference sequence are indicated by triangles. The two black boxes represent the rRNA genes and gray boxes the 14 coding sequences (abbreviated names underneath each gene).

