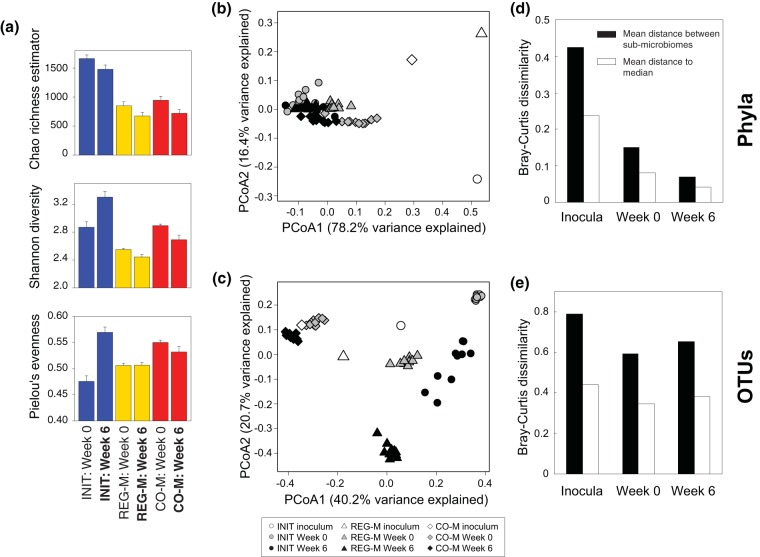
FIG 1.
Shifts in microbiome structure through time by microbiome type. (a) Metrics for operational taxonomic unit (OTU) richness, diversity, and evenness in the three microbiome types, both before and after incubation with crude oil. Bars represent standard errors or estimated standard errors in the case of the Chao richness estimator. Principal-coordinate analysis (PCoA) ordinations of Bray-Curtis dissimilarity at the phylum (b) and OTU (c) levels. Shapes colored in white represent the means of replicate DNA extractions from the initial inocula. For the REG-M and CO-M inocula, they represent the means of the two and three media types used to produce them, respectively, as bacteria from each media type were added in equal amounts. Bar charts showing mean Bray-Curtis distances between microbiome types and to the median of all samples at each time point are shown at both the phylum (d) and OTU (e) levels. INIT, sterile soil reinoculated with the initial soil; REG-M, sterile soil reinoculated with bacteria cultured on regular media; CO-M, sterile soil reinoculated with bacteria cultured on media containing crude oil; week 0, after 8 weeks stabilization in soil; week 6, after 6 weeks incubation with crude oil.

