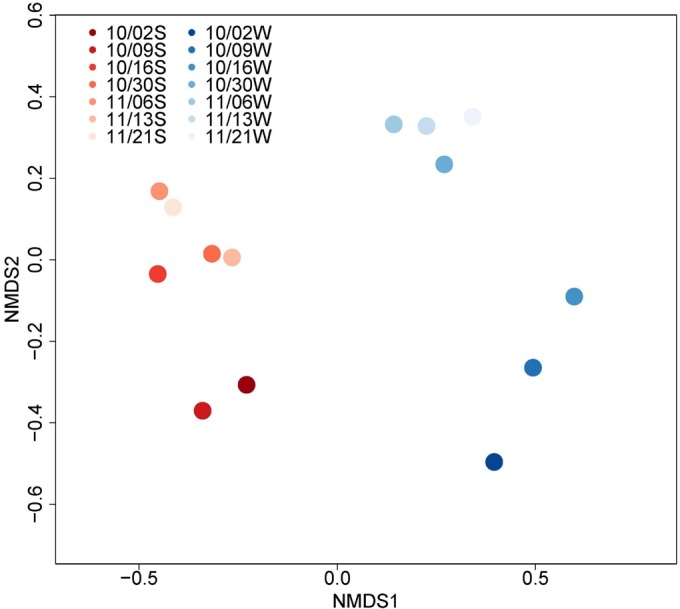
FIG 2.

Analysis of DNA sequencing of the 16S rRNA gene in water and sediment on seven dates at site NC-03. The blue gradient represents water samples, and the red gradient represents sediment samples; the color gradient represents different time points in either water (W) or sediment (S) where darker shades are immediately after the spill or earlier in time.
