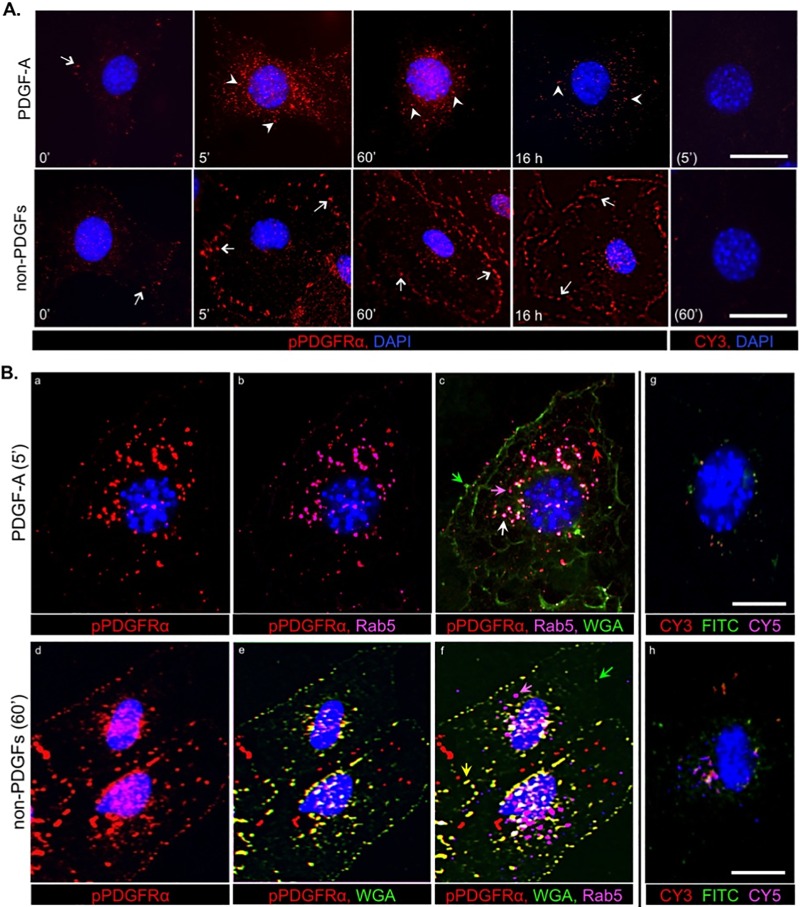
FIG 5.
The mode of PDGFRα activation determined its subcellular localization: an immunofluorescence approach. (A) Analysis by indirect immunofluorescence of PDGFRα phosphorylation and trafficking in MEFs stimulated with PDGF-A or non-PDGFs. Equivalent numbers of MEFs were seeded on coverslips in a 24-well plate and allowed to reach no more than ∼50% confluence before serum was withdrawn for 16 h and then stimulated for the indicated times with DMEM alone (0′ control), PDGF-A (0.5 nM), or non-PDGFs (0.5 nM total, comprising EGF, FGF-2, HGF, IGF-1, IL-6, TGF-α, CTGF, TGF-β1, TGF-β2, and G-CSF at 0.05 nM each). After treatment, the cells were subjected to immunofluorescence analysis (Materials and Methods) using anti-pPDGFRα, followed by a CY3-conjugated secondary antibody (emitting red fluorescence) and counterstained with DAPI. Arrows indicate regions on the cell surface colocalizing with pPDGFRα (cell surface staining using WGA is shown in panel B); arrowheads indicate vesicular structures (e.g., endosomes) colocalizing with pPDGFRα. Controls without primary antibody (rightmost panels) were stained with DAPI and CY3-conjugated secondary antibody; only DAPI could be seen in the resulting images. The images are representative of three independent experiments. (B) Analysis by indirect triple immunofluorescence of PDGFRα phosphorylation and subcellular localization after direct and indirect activation. MEFs were seeded on coverslips, cultured, and starved as for panel A and then stimulated with PDGF-A (0.5 nM) or non-PDGFs (0.5 nM total), same mixture as for panel A for 5 min and 60 min, respectively. These times were chosen based on the time course analysis in panel A when fluorescent signal intensities were highest. After treatment, the cells were subjected to sequential immunofluorescence analysis with first Alexa Fluor 488-wheat germ agglutinin (WGA-488, emitting green fluorescence), a potent lipophilic dye for staining plasma membranes, and then, after an extensive rinse and a brief permeabilization step (see Materials and Methods) to expose intracellular antigens, further staining with antibodies to pPDGFRα (anti-rabbit antibody) and Rab5 (anti-goat antibody; Rab5 is an early endosome marker), followed by the appropriate secondary antibodies: CY3-conjugated anti-rabbit antibody (emitting red fluorescence) and CY5-conjugated anti-goat antibody (emitting far red fluorescence, which was pseudocolored pink in the images for ease of analysis). All coverslips were counterstained with DAPI. The arrows shown on the four-color overlay images (c and f) provide an example of a particular colocalization. Green arrows indicate regions of plasma membrane devoid of pPDGFRα, magenta arrows indicate early endosomes devoid of pPDGFRα, red arrows indicate pPDGFRα-positive/Rab5-negative vesicles (e.g., late endosomes), white arrows indicate pPDGFRα-positive early endosomes, and yellow arrows indicate pPDGFRα-positive regions of the plasma membrane. The no primary antibody controls (rightmost images) were stained with DAPI and secondary antibodies (the two mentioned above, plus FITC-conjugated anti-rat antibody to pseudotype WGA-488); these panels define the background fluorescence for pPDGFRα, WGA and Rab5. The images are representative of three independent experiments. All scale bars shown are 50 μm.

