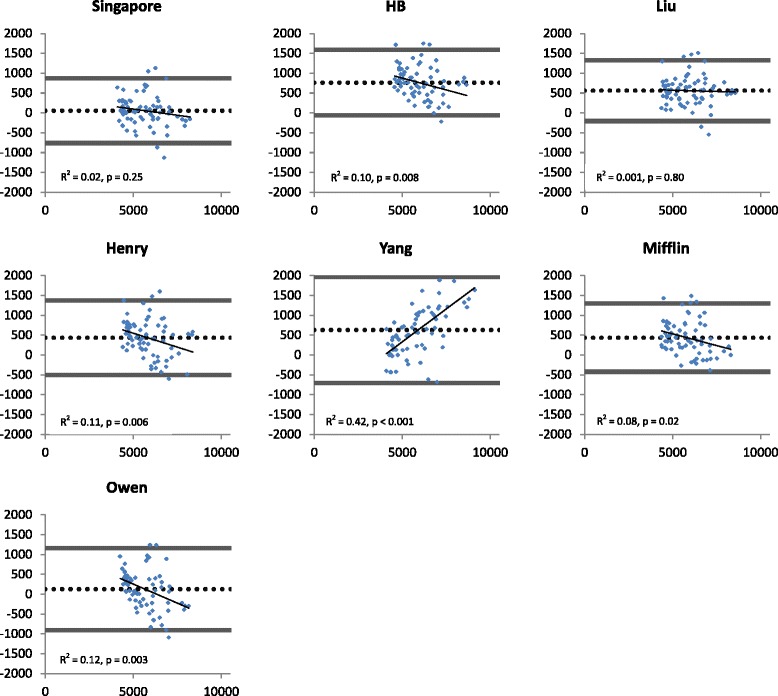
Fig. 2.

Bland-Altman plots describing agreement between measured BMR and predicted BMR from 7 equations in the cross-validation study (n = 70). Delta BMRp – BMRm (kJ/d) is plotted against the average of BMRm and BMRp (kJ/d). Reference lines represent the mean error (dotted line) of the prediction equation (bias) and the limits of agreement (±2 SD) (solid line). Regression lines, their coefficient of determination and p-value for the slope are provided. BMRp = predicted basal metabolic rate, BMRm = measured basal metabolic rate, HB = Harris and Benedict
