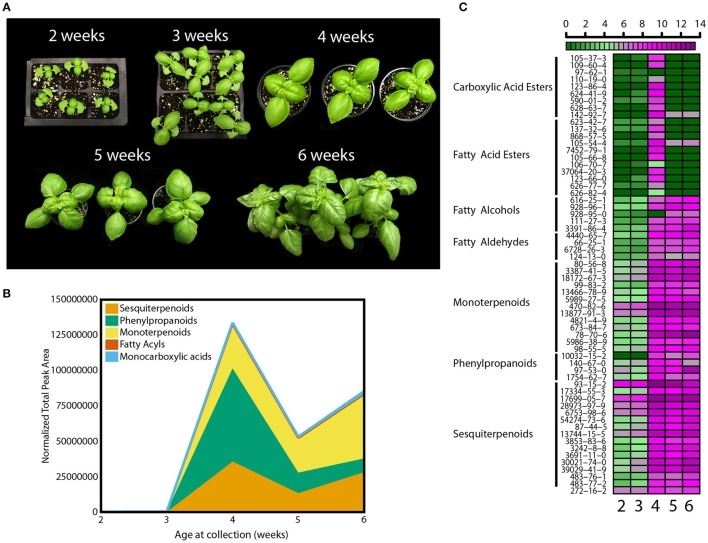
Figure 1.
Developmental effects on basil growth and metabolism. (A) Representative pictures from 2 to 6 weeks of plants grown in the greenhouse during the fall with (B) quantification of total volatiles and means of 5 subclasses, normalized by total peak area, and (C) heat map for individual volatile species, with relative quantification within the 5 time points; green and purple indicate low and high levels, respectively, as shown in the scale bar. Results are representative of two independent experiments (n = 3).

