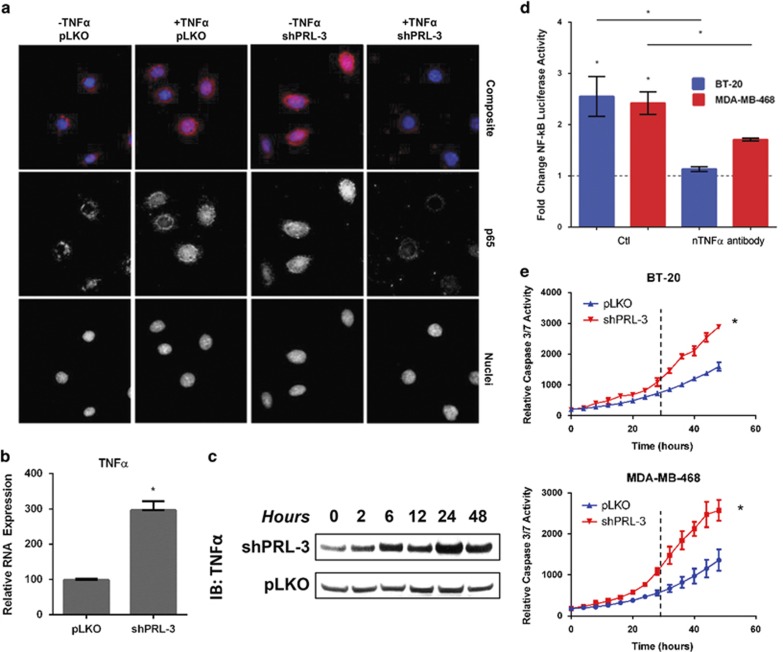
Figure 4.
Continued suppression of PRL-3 expression results in a TNFα-associated apoptosis feedback loop in TNBC cell lines. (a) Composite immunofluorescence images (top row) of p65 (middle row) and DAPI-stained nuclei (bottom row) following PRL-3 knockdown and treatment with 20 ng/ml TNFα in BT-20 cells. Images were captured at × 100 magnification. (b) Expression level of TNFα RNA at 24 h following PRL-3 knockdown in BT-20 cells as assessed by qRT–PCR. (c) Immunoblot analysis of secreted TNFα protein over the course of 48 h following PRL-3 knockdown in BT-20 cells. (d) Fold change of NF-ĸB activity in BT-20 (blue) and MDA-MB-468 (red) cells exhibiting PRL-3 knockdown, as assessed by transfection with an NF-ĸB-luciferase reporter plasmid. Cells were treated with a control IgG antibody (Ctl) or a neutralizing TNFα antibody (nTNFα antibody). Values were normalized to those from pLKO control cells. (e) Real-time kinetic monitoring of caspase-3/7 activity in control (blue) and PRL-3 knockdown (red) BT-20 and MDA-MB-468 cells as quantified by the IncuCyte Zoom Live Cell Imaging System. Data represented are the mean±s.d. of three independent experiments. *P<0.05 as determined by Student t-test. IB, immunoblot.

