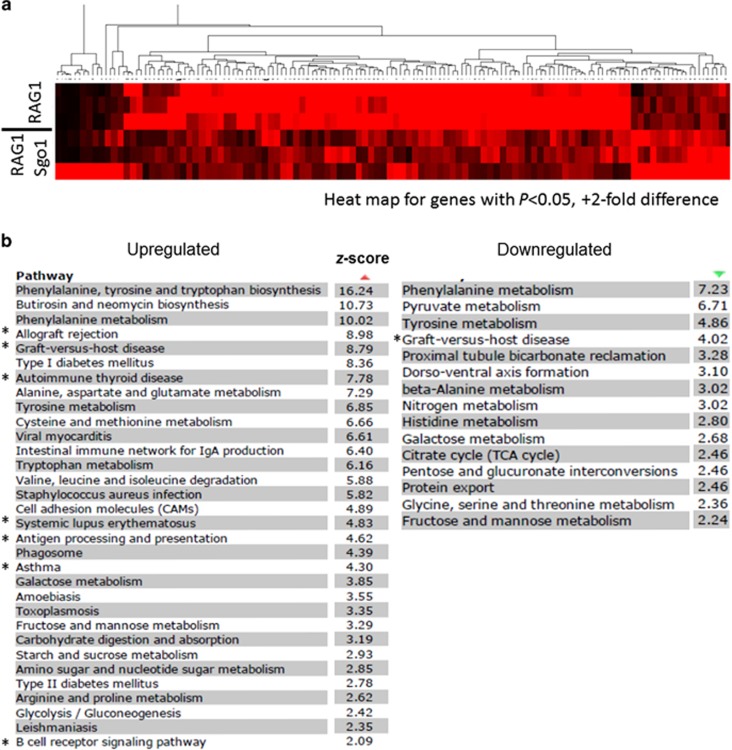
Figure 2.
Differentially expressed pathways in normal-looking lung tissues from RAG1−/− and RAG1−/− Sgo1−/+ mice. Next-generation sequencing/RNAseq identified 72 upregulated and 81 downregulated genes in lungs of RAG1−/− Sgo1−/+ mice compared with RAG1−/− (P<0.05, 2-fold). (a) Heat map for genes with P<0.05, +2-fold difference, indicating consistency within a group and difference between two groups. The colors represent the range of gene expression. Black, a reduced expression value; red, an increased expression value. The deeper color is a higher expression values whether reduced or increased. (b) Pathway analysis identified most affected pathways (z score >2). Asterisks (*) indicate immune function-related pathways shared with previous colonic transcriptome analysis between wild-type and Sgo1−/+ mice.37

