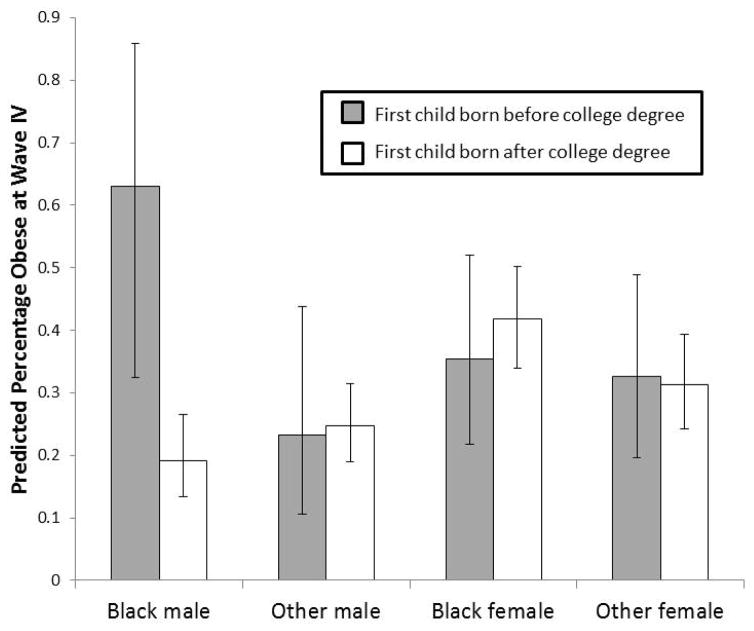
Figure 1. Graph of Three-Way Interaction: Obesity at Wave IV as a Function of Child/College Sequencing by Sex and Race, with 95% Confidence Intervals.
Notes: Graphs plotted for unmarried college graduates who are age 28 at Wave IV, had a BMI of 23 in adolescence, and have parents with no college education.

