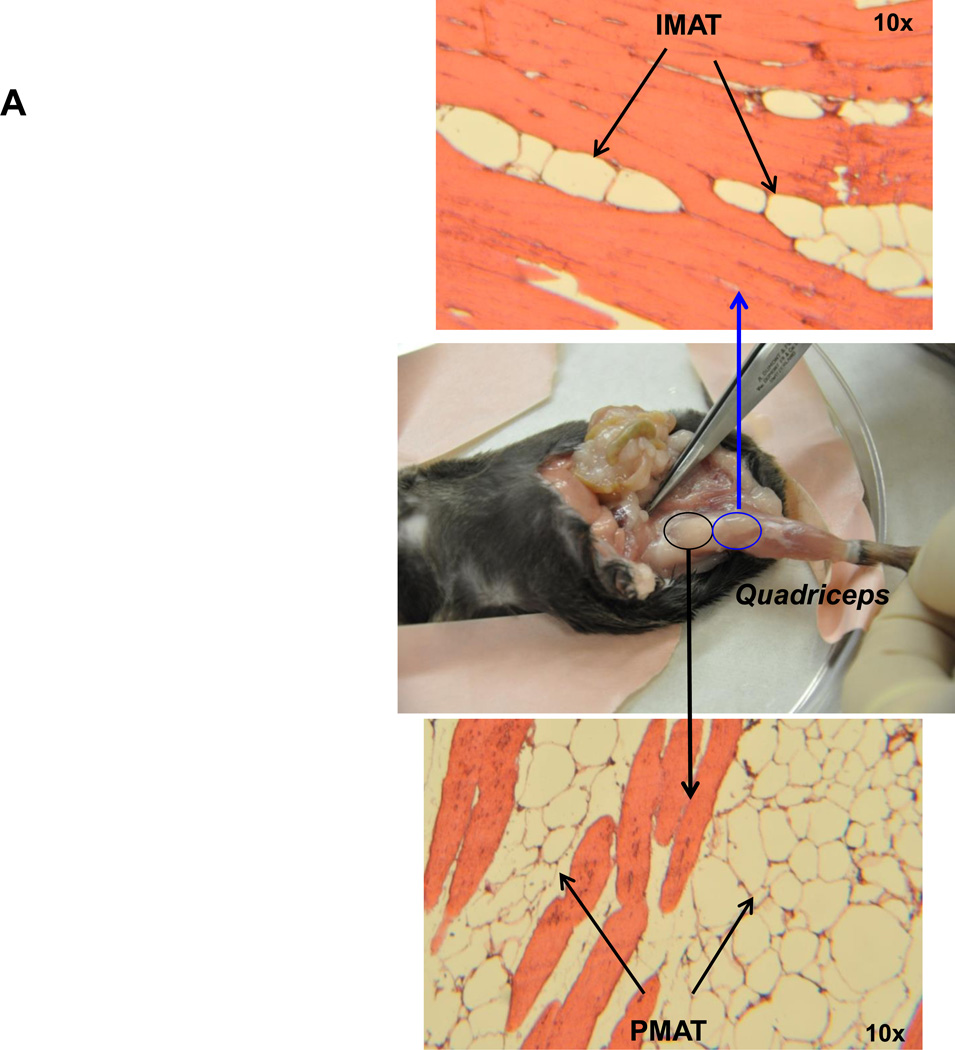
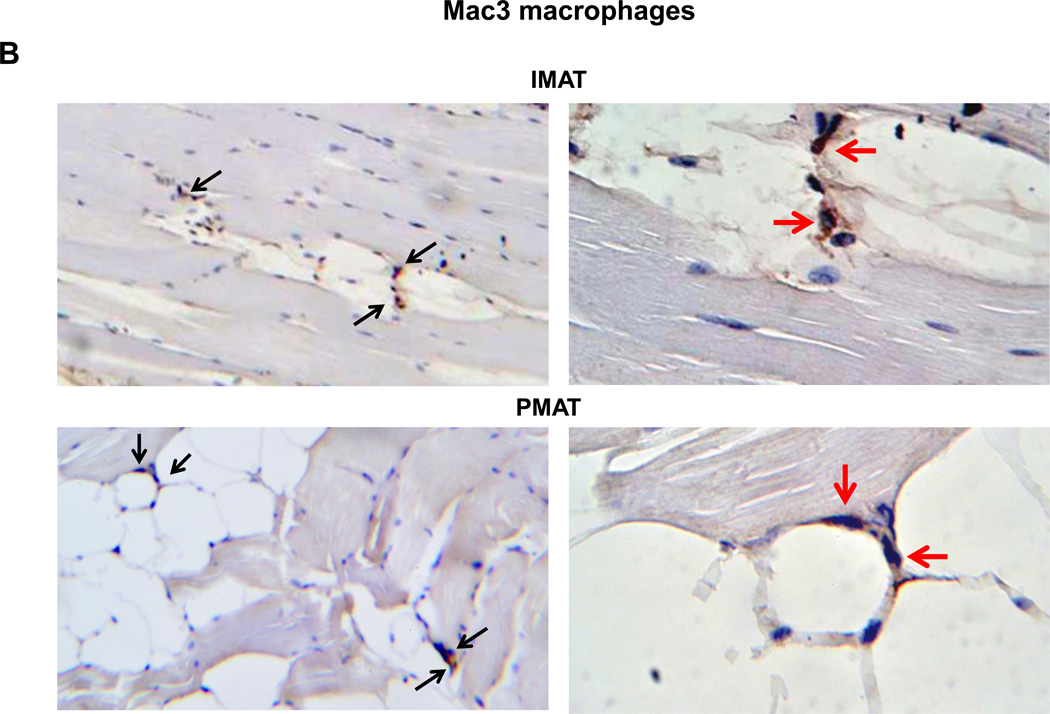
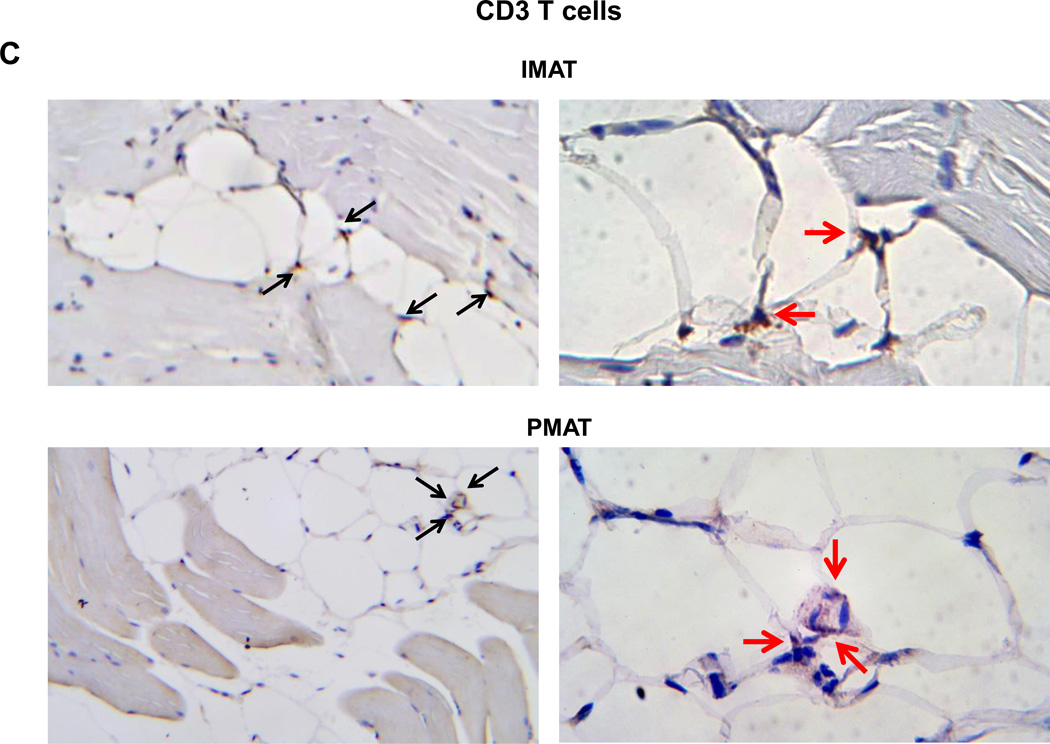
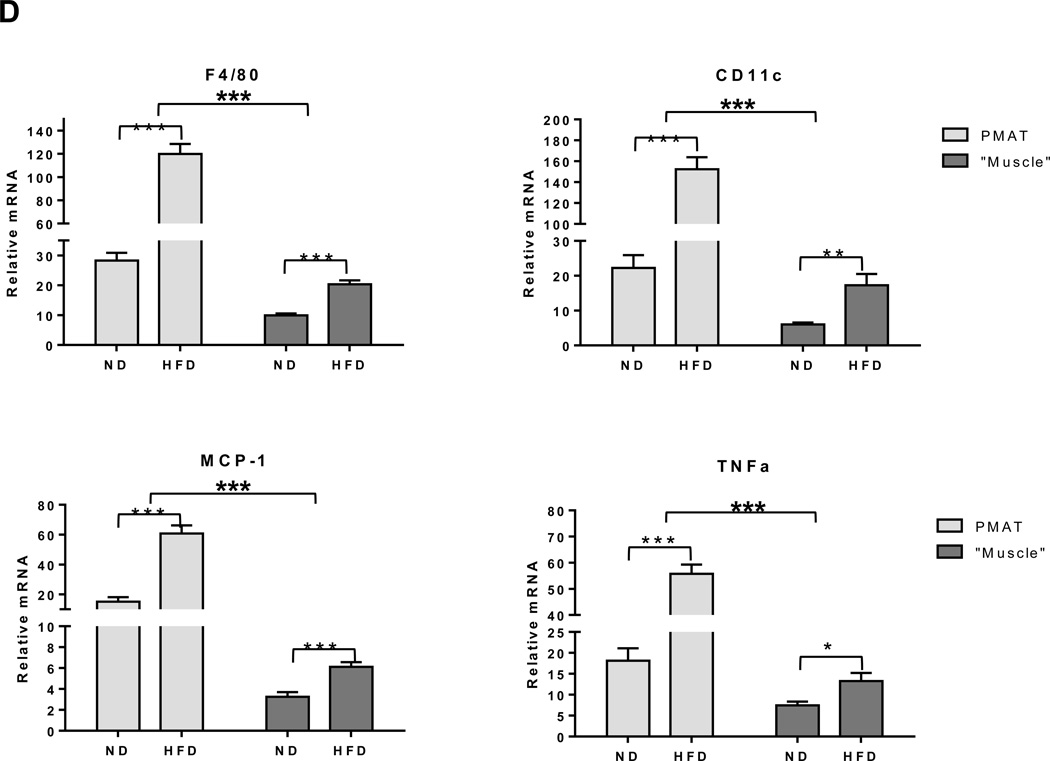
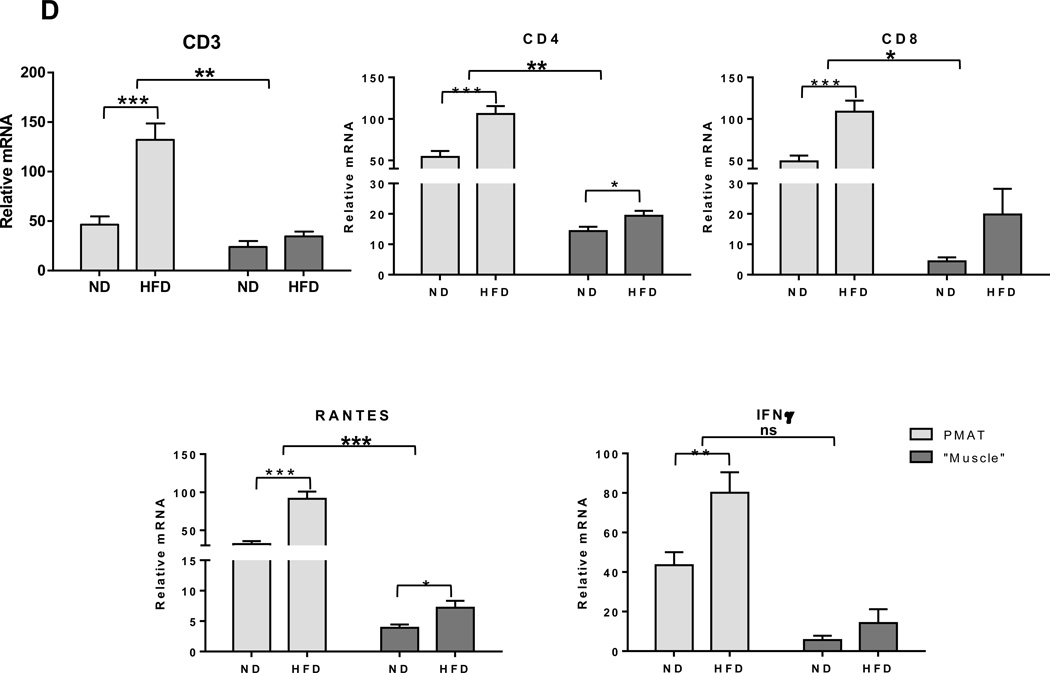
Figure 3. Macrophages and T cells accumulated in PMAT and IMAT of HFD-fed mice.
Quadriceps SM with IMAT and adherent PMAT were harvested from ND- and HFD-fed mice. (A) Location and representative H&E staining of quadriceps with PMAT and IMAT from HFD-fed mice, 10× magnification. Immunohistochemical staining of SM for (B) macrophages (Mac3, arrows) and (C) T cells (CD3, arrows) under 10× magnification (left panel) and 40× magnification (right panel). RNA was isolated from PMAT and “muscle,” which includes muscle fiber and IMAT, of ND- and HFD-fed mice (n=10 mice/group). (D) Quantitative RT-PCR analysis of macrophage markers (F4/80 and CD11c), T cell markers (CD3, CD4, and CD8), and cytokines/chemokines (TNFα, IFNγ, MCP-1, and RANTES). *P<0.05, **P<0.01, ***P<0.001. Student's t-test was performed to compare gene expression in PMAT or “muscle” between ND and HFD groups; two-way ANOVA was used to assess HFD-induced changes between PMAT and “muscle.”

