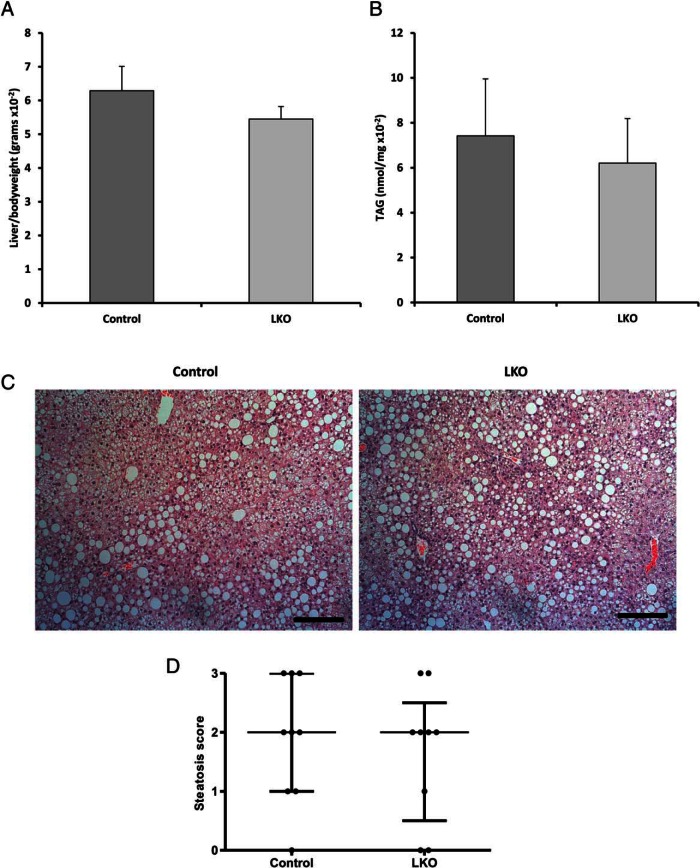
Figure 3.
Mice with hepatocyte-specific deletion of 11β-HSD1 have steatosis comparable with global KO mice. A, Liver to body weight ratios in controls and LKO. B, Hepatic TAG content in controls and LKO mice. C, H&E-stained sections cut at 5 μm of control and LKO liver demonstrating levels of macro- and microvesicular steatosis. D, Dot plot representing steatosis in livers of control and LKO mice, assessed using the NAS grading system. Mean ± SEM (A and B), interquartile range (D); n = 9 (control) and n = 9 (LKO). Scale bars, 200 μm.

