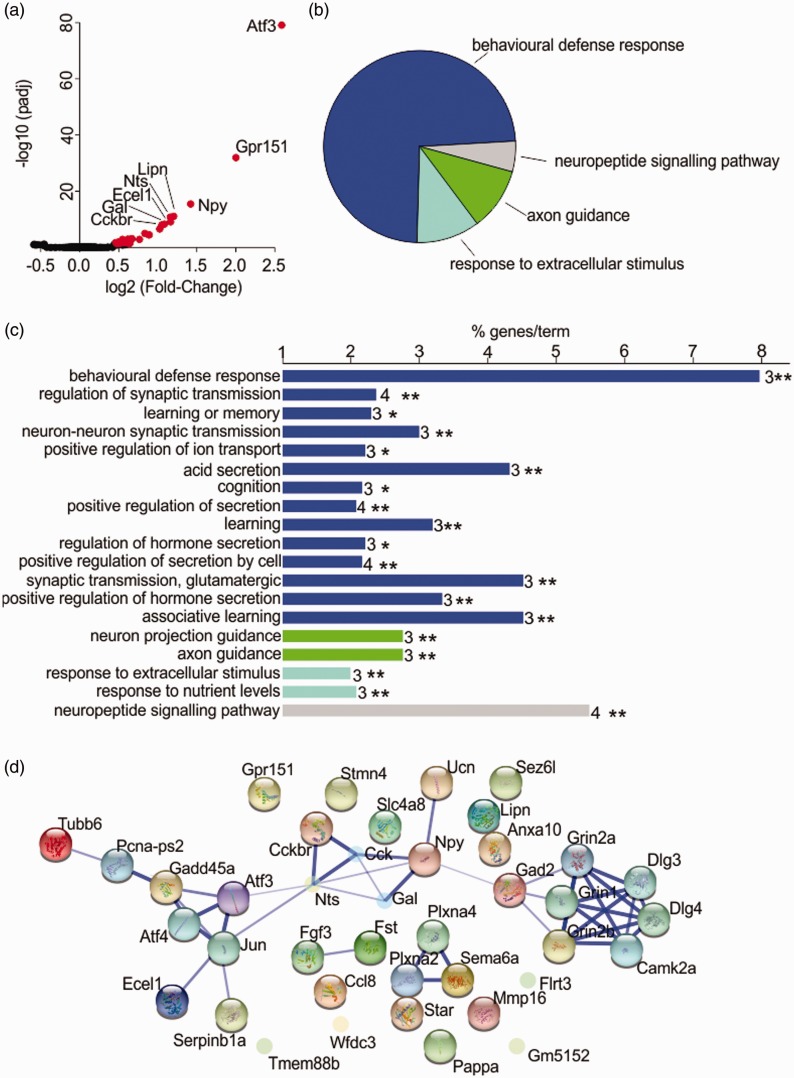
Figure 4.
Transcriptomic analysis of gene expression changes in DRGs after burn injury. (a) Volcano plot showing log of the fold change vs log10 of the adjusted P value. Genes with adjusted P values of < 0.05 are coloured red. (b) Gene Ontology analysis. Functional categories were assigned to genes within Cytoscape according to the Biological Processes pathways, version 30 April 2015. Visualisations were drawn with the Cytoscape plugin ClueGO. Genes were clustered into one main functional group and three smaller groups. Overview pie chart representative of the number of Gene Ontology interactions in each functional group is shown. (c) GO Biological Processes pathway terms for the differentially expressed genes. Numbers after the bar indicate the number of genes associated with each term. The X-axis indicates the percentage of associated genes for each term. Asterisks indicate the P value of the association after Bonferroni stepdown adjustment; * = P < 0.05, ** = P < 0.01. (d) Network analysis showing interactions between differentially expressed genes, generated with STRING version 10 and with the ‘More’ option (add 10 more gene partners) utilised once only. Diagram is presented in confidence view, and the thickness of edges connecting genes is determined by the strength of associations based on evidence.

