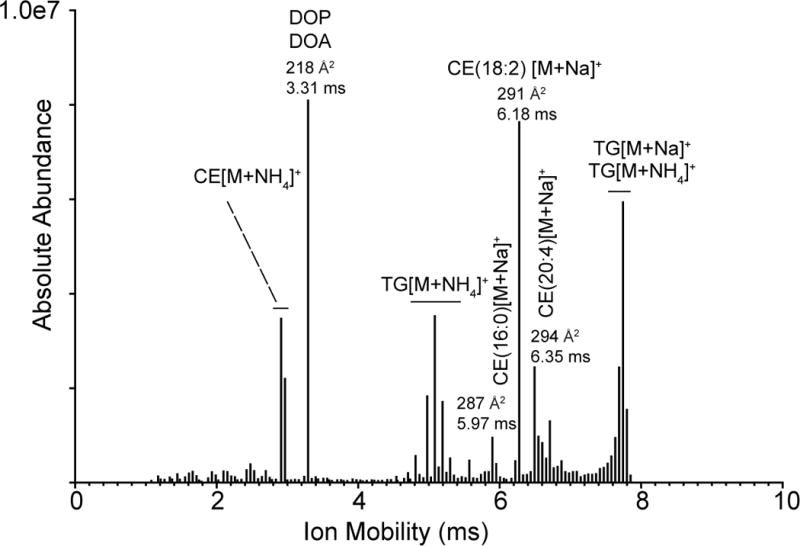
Figure 4.

A histogram showing the abundance of all product ions collected from the CTS experiment in the human serum sample as a function of ion mobility. The assignment of the neutral lipids at indicated times corresponds to the precursor ions selected when the product ions were generated with those mobility times.
