Figure 2.
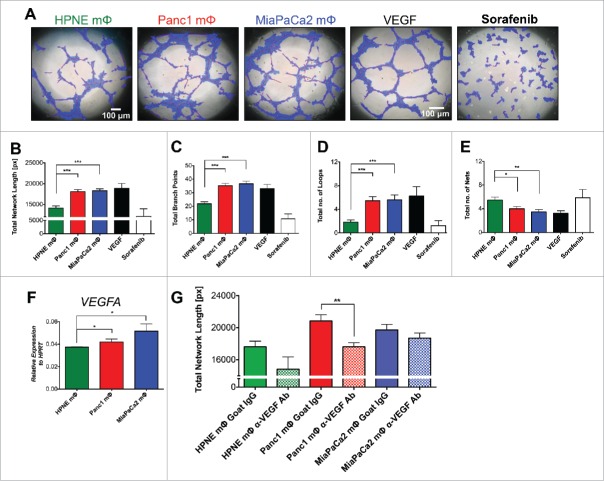
Panc1 and MiaPaCa2 mΦ promote higher rates of angiogenesis compared to HPNE mΦ. MΦ supernatants (sups) harvested from the three mΦ types were added to 1 × 10⁴ HUVECs grown on top of matrigel per well of Ibidi's μ-angiogenesis slide for 4 h at 37°C. 200 ng/mL rhVEGF-A and 10 μM of VEGFR inhibitor Sorafenib were used as a positive and negative control, respectively. (A) The representative bright-field images of HUVEC networks analyzed by Ibidi's WimTube Image Analysis software are shown. (B) Total network length (networks identified by red lines, length of tubes identified by blue regions), (C) total branch points, (D) total loops (identified by small yellow numbers) and (E) total nets are depicted in bar graphs as mean ± SEM of collated data from n = 6 independent experiments. (F) A bar graph of mean ± SEM of the expression of VEGFA by qPCR in the respective mΦ is shown. Data are representative of n = 3 independent experiments. (G) Shown are bar graphs of total network length in which VEGFA is neutralized in the macrophage supernatants by the addition of an anti-VEGF antibody. Data is collated from n = 4 independent experiments. *p < 0.05; **p < 0.01; ***p < 0.001.

