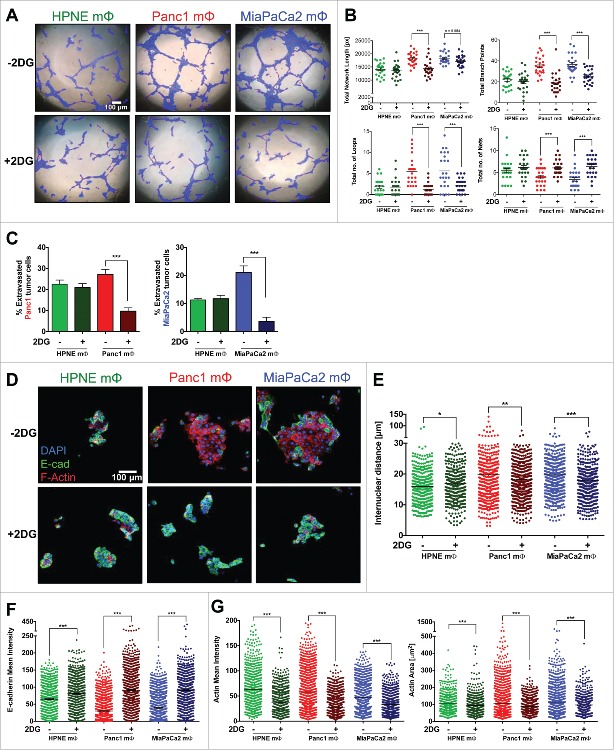
Figure 6.
2DG inhibition of glycolysis in Panc1 and MiaPaCa2 mΦ reverses pro-metastatic phenotype. After 7–9 d of monocytes co-cultured with HPNE, Panc1 and MiaPaCa2 conditioned media to obtain the three mΦ types, media was aspirated and replaced with fresh media with or without 25 mM 2DG for the next 6 h. MΦ supernatants were then harvested and used for downstream angiogenesis (A, B), extravasation (C) and EMT (D–G) assays. (A) The representative bright-field images of HUVEC networks analyzed by Ibidi's WimTube Image Analysis software are shown, along with (B) scatter plots of the mean ± SEM of the key metrics as described in Fig. 2. Data shown is collated from n = 6 independent experiments. (C) The bar graphs of the mean ± SEM of the percentage of extravasated cancer cells, using collated data from at least four devices per condition are shown. ***p < 0.001. (D) The representative immunofluorescence images of HPAF-II colonies incubated with the respective mΦ supernatants, stained with E-cadherin and phalloidin are shown. (E–G) The scatter plots of the mean ± SEM of internuclear distance (E), mean intensity of E-cadherin (F) and F-actin (G) and the area of F-actin (G) are shown. (E–G) Scatter plots are data of one experiment from at least eight colonies per condition. Data are representative of n = 6 independent experiments.

