Figure 3.

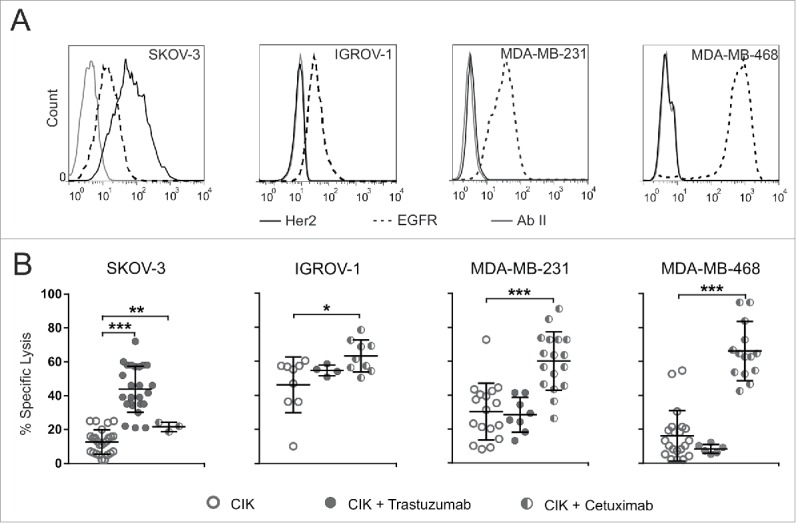
CIK cells engage CD16 and exert ADCC. (A) Target cells were analyzed for Her2 (black line) and EGFR (dotted line) expression by flow cytometry analysis. Fluorochrome-conjugated secondary antibody alone (gray line) served as negative control. Results are representative of five experiments. (B) CIK cells were challenged against SKOV-3, IGROV-1, MDA-MB-231 and MDA-MB-468 tumor cell lines. Lytic activity was measured using bulk CIK cells (day 21 of culture) in the absence (open circles) or presence of trastuzumab (gray circles) or cetuximab (half-filled circles). The symbols refer to the specific lysis of individual CIK cell cultures from different donors at an E/T ratio of 100:1, and bars indicate mean values ± SD. Data were analyzed by Student's t-test (***p ≤ 0.001; **p ≤ 0.01; *p ≤ 0.05; not statistically significant (p > 0.05) if not indicated).
